Stop Scrolling Through a pcap Looking for Red and Start Analyzing
Show original YouTube description
Show transcript [en]
so i made a commitment for this presentation there's not a single slide so as you can see by the very professional um presentation wireshark is fun and i think it is uh i live and die by the peak app it's my favorite thing ever um i'm actually going to move this mic to the other side if that's cool now that you all adjusted the cameras you're like dang it sean there we go okay cool so one thing that i always i always thought with wireshark and i've lived by it is the the devils and the details the devils in the packets i'd have application guys i come from a background of network troubleshooting i was on a lan
lan analyst team for 10 years um and i'd always have the application hey tell me hey it's the network it's always the network our logs say we're having network problems and i'd be like okay well cool let's get a packet capture and i give me a packet capture and i just show that it's not the network and they go well i still think it's the network okay that's fine right and i'd always like break out the osi model and i've said osi model and i've seen a few of you grown already but yes i live and die by the osi model and it's great um so we're going to dive right into wireshark like i'm not going to do any
other presentation starts but i want to see if has anyone ever done this you open up a p cap or if anyone's seen someone do this and they just start doing this this action you ever see this and then they scroll down and they're looking and they're looking like oh found the problem it's red there's red in that pcapp and then they go to their network guys and they say hey just so you know you've got tcp dupe acts on your network and the guys go okay that's great and pretty much all of your credentials and all of your uh goodwill that you've fostered over the years is now gone so at a brazen who's
actually opened and installed wireshark before who would consider themselves somewhat comfortable in wireshark a few cool that's good enough um i want this presentation to be kind of like the cafeteria style take what you like leave what you don't some of the stuff is my own personal preferences and how i do things if you like it great if you don't that's cool too the very first thing i'm going to say is ditch the default layout because it's terrible and if you use it you should feel bad because it was designed back when we had 43 monitors so i'm just going to switch the profile to my own fun fact you can actually have multiple configuration
profiles in wireshark so based on what you're doing if you're trying to troubleshoot a certain thing you can actually build an entire layout different columns different coloring rules based on different functions you're doing so if you're like doing slowness or resets or you're trying to do something completely different you can have different configuration profiles so you're not always going through and changing it which i found is great so i'm going to switch it over to mine and if someone wants this i'll be happy to give it to them again this is just my personal layout what i like to do as you can see i've changed the your packet list packet details back at bytes right
there you'll see my coloring rules are a little bit different and i've got different columns than most folks have i like it this way because i can use my widescreen monitors and kind of break this up a little bit you'll notice that i've got different columns first one is length and that's very important i'll show you why in a bit i've got delta time displayed and as you may or may not know that is the time difference between this packet and this packet is calculated that delta i've got an absolute time and i use that just for the old like when someone says you know the issue happened at three o'clock so i can go and go go look at three o'clock
most people don't know this but by default this time the default in wireshark the time if you don't go and change that to a utc time or something generic it'll actually change the time zone from where they captured it to your own think it's being helpful i've spent hours upon hours analyzing a trace when they said the problem happened at 4 00 p.m and it was on the east coast and i was in utah and i was looking at two and i'm like i'm not seeing anything well turns out wireshark was doing that for me um so yeah the first thing you do change layouts um all that stuff um i kind of want to talk about
filtering filtering is the real power that comes with wireshark and and i worry that people get um intimidated by it like they're like i don't know the syntax and i don't know how to do it they've actually built a pretty robust click point-and-click like gui driven filtering that that you can take advantage of so literally i'm just going to start scrolling this random trace and i'm going to go to that git right who's familiar with the tcp three-way handshake you know that sin snack act we've seen that before what if you want to see all the sins in the packet capture well the cheaters are just going to go like this tcp.1 right we have them memorize some
of us some of us don't well those same they're that same information is in every packet if you just drop down to your tcp header here go down to your synbit you can right click on that prepare filter and do selected tsp flags at syn equals zero chain it to a one you just built there's all your sins in your whole trace right cool gui driven way to do it um super handy let's say for example um we want to see all of the times that a box reached out to cert or any box reached out to a certain host i'm going to switch captures here i'm actually using the ctf pcap from sync con this year thanks to them for
them to use this it was super helpful if you didn't get a chance to do that at st khan try next time really great a lot of fun um let's just say i want to find out every time someone reached out to a bad host so i'm just going to do http for my filter there just show me the http for now and again we're going to drill down just like we did before for those that aren't comfortable with the osi model i can make it even simple layer two layer three layer four application layer that's the simplest way to remember it but we're gonna drop down to this http and there's the host that's the host
we're gonna right click on that prepare a filter selected http.host right there that's how you can build that build those filters if you don't want to remember the syntax you don't want to learn this syntax you're still getting used to it and you'll eventually get there and you'll start remembering and that's great but there's it's nice to have some gui driven things to kind of help you there in the beginning one thing you can also do that a lot of folks don't hang out with let's say you've got a ton of data and you don't want to filter it that way and you just want to have a header or excuse me a column and you want to see that you can
actually right click on any of these things down here and then do a applies column and then you're going to get grumpy because wireshark doesn't like adding columns while you do it you're going to have to click and drag and move around then suddenly it'll show up on that right side and there it is so if you're looking this trace kind of like holistically and you do want to scroll through and say who's everyone that talked out to this particular host super cool now let's say you don't want to scroll let's say i've got this let's say you took the trace from a mirrored port um on the egress of your network which is fine you take out an airport
and you've got tons of hosts you're like i don't know every single host that reached out to this particular bad actor this accounting.acmephysics.com that is throwing credentials out in the clear but we're not going to worry about that for now so what you can actually do is go out here to your um statistics hit your conversations limit that to your display filter because we are filtering on that bad host and from there there's only one host to talk to it but that would actually dump an entire list of every host that reached out and docked to it so if you wanted a quick who got popped run that be super easy um another thing that comes through a lot
as i mentioned tracing and doing a mirrored port trace a lot of times when as a um as a as a packet analyzer you'll say hey i want you to give me a packet capture and i want you to take it from a mirrored port i don't want it on the machine i want it for my mirrored port and they're like okay sure and they think they're going to pull a sneaky on you and they'll just capture it on the machine and the first thing i do every trace i get i kind of try to figure out where did this trace come from now one super cool thing about ethernet is for a packet to live on the wire it's got to
be at least a length of 60. now it's 60 plus 4 bytes for error or track summing but wireshark wireshark strips those off for us so there's 60. so if i ever get a trace that is the minimum like 60 and you can actually sort by that i'll know that this trace was likely captured external to a machine but if i get a trace that looks a little bit different i'll show you that let's do our ttl little example
and go up here i've got packets that are less than 60. and i can click on one of those or i can click on them there's actually a lot of them on this one let's just grab one of these i now know that the source where this was captured was this microsoft device right here with this mac address because my packet length is 54 and then that's my source mac address right there so when everyone says hey yep i absolutely mirrored a port and i see packs that are less than 60 i go no you didn't why don't you go get me another trace and they'll double down they'll say no i'm mirrored a port i'm
like okay you really didn't want to give me that trace and then magically we got someone else involved and then the trace i want actually shows up which is super super handy to have so just these small little tips and tricks that i'm showing you are kind of things that you just need to build in your brain as you become an analyzer going okay check the packet length is it less than 60 great this trace was taken from this particular perspective right um on that note i'm actually using hard copy for my outline you like that old school time um one cool trick i want to show you um i call it bookmarking and bookmarking is
something and we're actually going to we're going to do a demo lose a sale here why not this is crazy we're gonna do it anyway one thing we like to do we're gonna get on a network here lh miller was that it no one thing we like to do is we're gonna go to captures and get on our wi-fi and we're gonna start capturing stuff oh cool we're capturing stuff so let's say the problem statement is i try to go out to google and it doesn't load that's just the problem statement one thing i will always like to do is i'll get everything kind of pre-staged and i'll get my browser open and i'm already tracing so i'm like wasting time
but we're going to do it anyway and then our mouse is going to die and it's going to look really awkward on camera that's awesome touch screens cool so we're going to ping 8.8.8.8 and then we're going to go over here wait until that's done four pings great and then we're going to go to google and i'm just going to go to google again that's a lot of fun and then i'm going to ping 8.8.8. again and four more pings cool and i'm going to stop my trace now in my trace if i go for icmp there's my pings that i sent to google right i now know that in between these pings my problem occurred or the issue i was
trying to reproduce occurred so one cool trick that i like to do is if i go into this wow now i have no mouse this is super nice you can right click on these and set a time reference now the cool thing about a time reference is time references will show up no matter what filter you are doing so let's say i want to see just uh tcp.port equals equals 443. as i look here in this trace i can find my bookmarks sorry i'm gonna cheat
they are right
i saw them another gone actually we're going to do a different way we're going to cheat a different way because it's a better example so same setup
and we're going to ping 8.8.8 and then i'm going to do a test net connection um google.com dashboard 81. and then i'm making my attempt and then i'm going to do ping 8.8.8 stop my trace um i'm going to tag those pings really quick just so i have them and then remember i'm going to use that set time reference and i'm going to set another time reference now i'm not doing it in between the actual ones but i'm just giving you the example and then if i do tcp dot port equals equals 81 those pins still show up even though that's not in my current filter they show up so you tag your first one before you
duplicate you duplicate problem you tag your next one and then as you filter those will always show up and you'll find the problem you're looking for so pretty handy i use that quite a bit one danger of that is you'll notice like this is the display filter and when you're filtering or when you're tracing you can actually do a a filter on your trace when you take it and just a word of warning on that don't don't filter your trace before you don't filter your trace while you capture it filter the trace um afterwards while you're doing the analyst but capture every packet you get it i always i'm gonna go back to buffet analogy let me pick out my own food
don't hand me a plate on what you want to give me right let me go through as an analyst and find those packets unless you're in a scenario where it's going to be so ginormous you can't really try to avoid capture filtering from the get-go and the reason is you run into dangers we're let's just say we're for example let's say we had a ping pong and we wanted to find it and we're gonna start another trace here and for my test case i'm to ping this isn't a real oops we're going to put those in there in a real domain and this won't work and they say okay i duplicate it for that and you look in here there's no
icmp well of course there's no icmp we failed well before that even happened we failed on name resolution so this just illustrates the point capture everything analyze second i've been burnt way too many times personally of doing just that thing i'll say yeah it's probably okay this time filter the traces you capture and then within a few hours i'm like no go give me an unfiltered one now one other i think how many people work in environments where it's like you can't just install whatever you want on our machines you have any of those and you say i want to get a trace and it's like we'll put wireshark on there they're going to be like no
well you could always do net sh trace start capture equals yes that's built in you can run that you'll get an etl file which can be exported to a pcap but you can actually go ahead and run this on pretty much any modern windows box um and snag your trace that way i have to do that quite often the funny thing is i know about this and i use this pretty often i'll still tell people install wireshark not thinking like yeah just install washer and get a trace oh wait you could use an ssh and there might just go through it um this isn't a linux box obviously but for linux friends
there's your linux version that's what your command you'd use for that um tcp dump is our friend we snag those okay now one other thing i like to bring up is i've been in places where i say hey you know what i want to get a trace and they're like this is a secure facility we can't give you a trace i'm like okay can i have headers and they'll be like yeah we even have headers and then they'll try to take a capture and um they'll end up grabbing everything i'm like well actually it gave me everything but i really wanted your headers if you wanted to do that you can actually go to your capture options here
go to your output well not output on your input sorry go ahead here to snap length change that to 54 and you'll snag headers and headers only um really useful if some folks are saying hey we don't want to see we don't want you to see our application traffic just give me the headers some still information can be get got can be analyzed from the headers it's not as great as having everything but it's a way that you can kind of appease the masses if they don't want to give you a trace the other very common thing when taking a trace that i always hear is well the issue is intermittent it happens sometimes and i hear that so many times
um that's when you use what's called a ring trace and so what you'll do is you'll have this new file creation automatically you can you can trigger a new file based on how long the trace was how many like multiples of hours i normally just basically say give me rings of like a gig each and then use me a ring buffer of like five or so so depending on how busy the network is that'll that'll obviously influence how big those files are um but yeah get this trace going and say hey the moment you see the problem you let me know and then you can remote in and stop the trace or you can have an admin remote stop trace
having that ring buffer of five files building a gig file each time usually enough time to get in there and stop it so very useful for intermittent issues times you don't see you know sometimes when things aren't happening all the time you can't trigger it it's kind of a there's an outside condition causing it all that good stuff like that um cool on that note i'm going to dive in some traces i'm just trying to show you some cool stuff that we find on here okay i'm not really doing this i promise cool so what we're going to do is we talked about the three-way handshake a little bit before um let's open up our
let's do an unanswered sin so let's just snag oh actually did i keep that trace this one just did i think it was
okay so this is a so i'm looking for the sinbits over the tcp three-way handshake a sins and a one thing you can do if you're wanting to look for your unanswered ones you can actually go here to your statistics and then go to your conversations and then limit that to our display filter and anytime when you've got host a and host b if one of these is has like three four or five packets and the end one is zero those are unanswered sins so if you're trying to troubleshoot something where let's say you've got an application where you don't know the port it's going to be listening on or with that dynamic and you're like i just
need to see all the times that a sin failed do that display filter to see all those sins to speed up flags flags.equal equals one equals equals one and then head out to where there's zero responses here um quick way you can just find those that those sins that go unanswered um there there's always there's always tips and tricks and things that speed that up but honestly using these built-in statistics conversations your endpoints your io graphs these are the things that help you focus in on what you're going to be looking for specifically because it's really easy in a pcap and i do it all the time is i'll pigeonhole myself down a path and i'll start
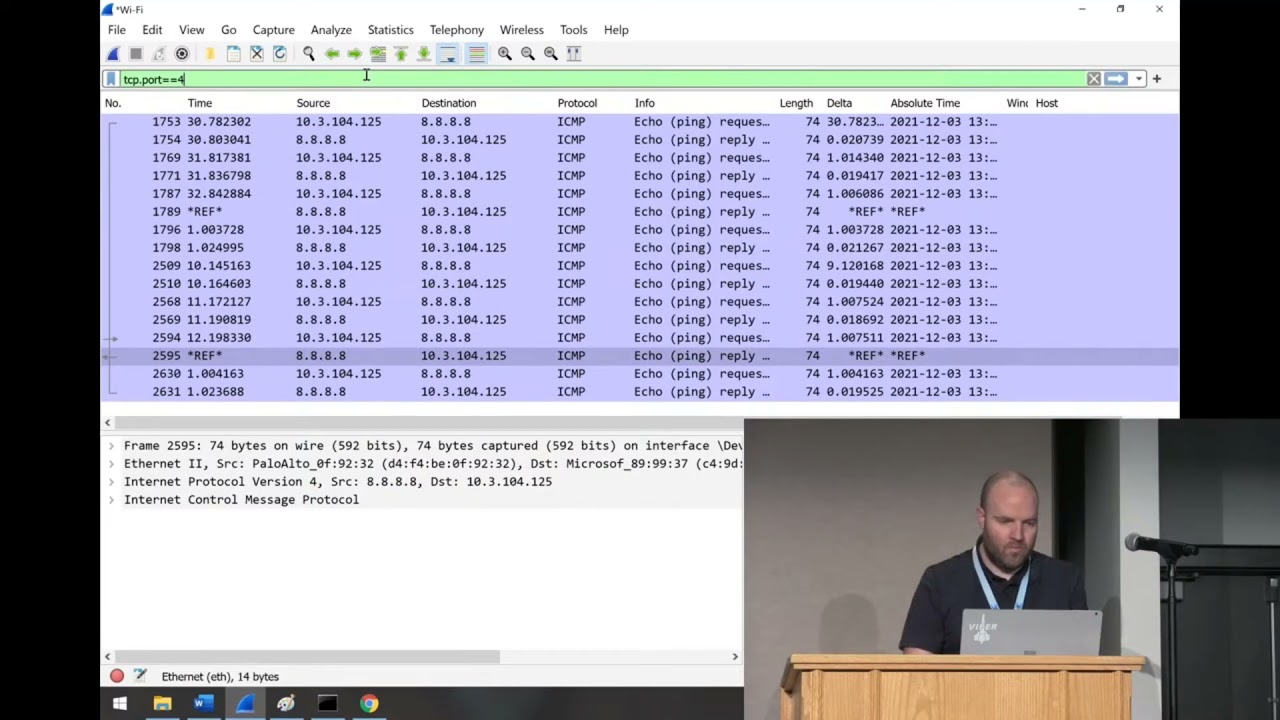
looking just like oh there's some errors i'm just going to sprint off in that direction i do that myself often but using these built-in the conversations the endpoints all that is is kind of a good way to keep that holistic view of what you're looking at one thing i want to check show you is we're going to open up this ttl example right here and throw that trace away and then i'm going to filter to this because i've already made this trace beforehand it's like those cooking shelves where they have all the ingredients lined up in little bowls these are my little bowls of ingredients here so what this is is this is a machine
reaching out via tls https and there's that three-way handshake we know and love since the netgack we love it so much um as we go down it has some communication this is encrypted so i can't see what it is um scrolling around scrolling down all sudden i get a reset now everyone's going to play the game of well who sent the reset why did i get reset now at face value you're going to say well obviously this 172.217.7.110 sent me a reset it's in the packet list i can see that not entirely case i'm going to show you the beauty that is the ip header down here this is the ip header and you've got this time to live of 128.
now this is my own machine this 192.168.1.89 the server that i've been talking to has a time to live a 59. now these time delivers in routing world they start at some number depending on the manufacturer it'll either be 128 or 64 or some older stuff 255. and as it goes through each router it decrements that time to live by one reason being if you didn't do that there'd be packets still circling the globe today you basically have to say if you can't find your way someone needs to throw them away so you set this time to live and say if after 64 hops you don't find it i am so sorry for your loss you're getting discarded
now how is that useful for us well i know that this guy that i've been talking to that's been working fine is the time to lose 59 i just got a reset from that guy that has a time to live a 64. why do i have a time to why did my time to live suddenly change answer that question that far side did not send that reset that far side was sent by my router on my local broadcast domain because it's 64 hasn't been decremented so a firewall in the middle reset that connection the reason i know it did that is because i actually did that on my firewall to make this example however if you look at that and and you'll run
into this a bunch when you're doing and doing um doing analysis you'll see resets the first thing you'll always want to check is check that conversation you've been having this whole time and see if that time to list has changed if that time to live has suddenly changed good chance there's something in them might not be a firewall it might be something else something in the middle has introducted itself and then count the hops away of how far it is to start looking to start furthering your investigation that way in the world of pcaps not every time will there be like a smoking gun in your trace what it will do is it'll say hey
here's our next place we're going to look at i know i got to reset on my local network i now know i need to investigate my gateway because he's in my broadcast domain that reset had a timeline of 64. so it hadn't been decremented that's my area i need to focus my investigation so kind of cool that's probably that honestly if i just say like the best trick that not best trick but the best thing to learn out of this is if you're trying to find connection breakdowns look at your time to live moving on um i'm going to show you i took a bunch of traces like samba samba like and i was doing kind of older
school song i wasn't doing anything fancy samba 3 stuff um i'm going to look at this samba client 200 millisecond latency um and what i did on this trace is i have a samba server that was just running on an ubuntu box and then i use traffic control on linux uh traffic control is a cool utility you can simulate all sorts of network problems you can throw 200 milliseconds of latency on every socket you can corrupt or garble five percent of your packets you can tell it to retransmit tempers in your packets really useful for building traces for examples but also useful if you want to say hey what would the real world example be if i had
a big long wand link across the country with an 80 millisecond delay you can introduce those um delays in in in your trace so this is a samba this is a transfer samba and i'm going to practice repeat preach and look at the conversations on this trace and you can see a bunch of conversations a bunch of stuff was going on that network if we actually just flip around those bytes one of those conversations is a lot bigger than the other ones that's 88 megs and um we'll go to tcp so tcp port 445 that's a windows file copy right one thing you can do right here right click on that prepare filter selected a to b
close that and that's filtering to just that connection without having to type a single query command so super handy super cool to do now one thing i want to show you in statistics if we go to our service response time and go to smb2 it's going to load that up this is every call that was made and you can do display filters here so you can actually copy pasta this one right here down to the display filter if you wanted but since the trace really only had one big summit connection and this is it you can see the minimum service response time the max response time and your average response time for each one of these
verbs so i did 77 verbs and my minimum was 0.2 because remember i said that 200 millisecond delay and my max was point was 8.4 with an average of 5. the sum of all those verbs were 427 seconds so what does this tell us is this a smoking gun in this trace no it's not but what you can now do with this information is say come start comparing these numbers now since mine's an artificial trace and i added that artificial let's say we're doing a sama transfer in that file and that back in storage is on a is on a lawn on our sand somewhere and that one's having issues but only on reeds you could
actually notice that these reeds are much higher or much lower than the writes so you can use this from by the nature of investigating the protocol you can actually use this information to say hey we're reading great read performance fantastic right performance not so much and so it will kind of guide you into the next thing that you want to that you want to take a look at um one other cool thing i want to show about performance and we're going to use the same trace we're going to packet 693 for example right here i started this trace kind of in the middle so you don't see the actual tcp three hammer three-way handshake the the
socket had already been established but i want to point out this packet right here this is me 192.168.1.95 talking to 192.168.1.99 and i'm doing a smb verb of tree connect request and that's the path that i try to do notice this next packet right here doesn't have any application data in it you see how it's just layer 4 there's just tcp and then right next is the tree connect response which is the actual response to that tree connect i did why is there a tcp right there in the middle the answer to that is the application layer hadn't responded yet i had done a request to do that tree connect and say hey i want to talk to this ip and i'm
looking for the ipc dollar sign share tcp after waiting and remember we're going back to that delta that i would leave up t is people waited now tcp waited 200 milliseconds before it sent that response now since i have that artificial in there that number's gonna be a little skewed but if an application doesn't respond in a timely manner the tcp stack's gonna act that packet and say hey you know what i got your request don't send it again i'm working on just hang out for a bit and you'll see that all the time now how is that useful when you're analyzing traces if you see a bunch of that if you see the package the request the application
layer requests go out that tree connect or whatever an http get and you see tcp ack it really quick and then wait and then wait and then the application exit and that pattern goes through all that or it keeps following that pattern you can say well my network's really not having problem delaying delivering those packets i'm getting a tcpac lickety-split but the application layer is not responding to me in a timely manner so from there you can now focus your investigation to whatever damon's listening on that back end whether it be apache nginx whatever because and they'll say well it's a network problem it's slow slow equals network problem always because that's what we've trained
ourselves to do however by using this trace you can actually say nope i made it lickety-split and for whatever reason your application responds in a timely manner now we need to go look at that application so super cool check for that when you're looking at traces and you'll see this one has a ton of those examples examples there's a create request there's the tcpac there's another one there's a tcp act so yeah just keep your eye out for that and as you kind of get more comfortable and as you keep doing these you start learning these patterns you're gonna start learning hey i'm getting tcpx but not application layer x let's go look at the application layer
um another cool thing we're going to jump to a different trace again again this is the cafeteria i'm literally just like throwing food out on the thing and just take what you like and what you don't like saying no thanks we're going to go to this five percent corrupt and as you can see i cannot spell the word corrupt that's corrupt whatever that was and if that wants oh let's get rid of our filters that's better so i've got another trace and what i did is i told um i told tc on um on linux go ahead and corrupt five percent of the trap packets just for funsies just corrupt them and then i said and by the way do a random
smattering of retrans just as much as you want and 10 which is a lot let's say you've just got some slowness you don't like how it's running one great thing you can do is go here to your statistics or sorry analyze and then go to your expert information and again like before i can still limit to my display filter so just look at what we want to see and there's an error and i've got oh malform packet there's only one of them that's interesting so let's take off that display filter and look at all of our others wow we've got 11 538 retrains why did i not see it the first time because i filtered only to smb2 and so as
relying on wireshark's dissector the looks of those packets and make sure there's an application layer header on there that says this is smb2 and that's how it was classifying it since i got rid of that and i undid that display filter now i'm seeing anything that is a suspected retrans and i've got 11 538 of those retransmits cool thing you can do click that drop down right there and as you click through it'll actually take you in the trace where they are now you'll notice in the background it's saying it's not displayed that's because i've still got this filter on there take that off go back to here try to find your retrans there they are
and as you click through it'll actually take you in the trace in the background you can see it's moving around there to all those retrans now granted you're gonna get retrans you're gonna get dupac's that's tcp doing its job it's going to do that that's just how it works don't go crazy going oh my goodness i'm having 100 retransmits in 30 000 packets guess what who cares that's tcp let us do a thing but if you're seeing in a trace that's only a few seconds long you've got 12 000 retrans you've probably got something you need to look at there right now moving right along to our um the world of samba i'm staying sam just
because it's kind of easy to illustrate i'm going to go to samba wireless and all this was this was me just copying a file across my network over wireless really not super exciting it is kind of a big file because obviously i captured everything because filter second not first that's my golden rule and so now we just get to awkwardly look while my laptop reads these packets so how we all doing good great
cool here we go now one thing i want to show you is i'm just going to filter this trace in the display filter i'm just going to filter to port 445 just to save us a little bit of time as i go into my next area that i'm going to show you so we don't have to do this more than once wireshark has a built-in i o graph that will actually calculate your your input output speed based on the packets coming through it um this is super handy especially when you have users telling you hey you know file copies are slow they're they're not going to expect i'm getting one megabit or they give you some
arbitrary number you can actually capture that packet or capture that trace as they do it and see what the actual um what the actual speed looks like that's here on your statistics under your io graphs and again you can filter this down to i'm going to go to all packets and i'll pick them into the port 445 and we're going to recalculate that
and while we do that i'm going to bring up the screenshot of windows what it showed so we have that up there that work yeah you can see that cool as we load um you can see kind of the hills and valleys here this obviously windows is smoothing that out and it's not giving the exact number at each step but it kind of gives you the average
and if we look at that graph you actually see it looks pretty similar as far as there's obviously a lot more detail here in the in the wireshark version of it but you can see that pattern follows a pretty similar drop is that so you can actually extract this performance out from the from the raw trace itself um on that note um a lot of times when you're taking when you're talking about performance tracing getting one side of a conversation isn't super helpful because you'll you're tracing from the work from the um the viewpoint of this workstation you're sending out across the wire and you're just waiting whatever comes back to you right so what we'll do a lot of times
we'll call do what's called simultaneous traces where i'll trace here and i'll trace on the server at the same time and and we'll compare them and see what's going on well one thing you need to do when you do that is line your packets up in your list because you'll have a bunch of packets here from this workstation which is obviously being exposed to different networks that it's seeing you've got your server network that's being exposed to different networks and different packets and all that good stuff so you need a good way to line those up so i'm going to show you the niftiest trick ever to line those up we are going to go back to our
200 millisecond latency there's the client side
we're going to open wireshark again
and we're going to open the server side uh there's the server side and thanks to the magic of wide screens we're going to go like that and it's a little smashed and i'm sorry it doesn't look great but that's kind of the best we can do so we're going to go like this tcp.port equals 445. okay so we just filtered it basically to sombon both sides if you go to one of these packets and just pick a packet that you like doesn't matter which one let's just do this tree connect you go to your ip header and each one has this identification on it you can right click on that prepare a filter selected hit enter on that
there's that particular ipid copy that go to our other trace go like that there it is right click on there and do mark packet do mark packet you could do a time reference if you wanted to show up all the time and then when we go back to our default filter
and those two traces you see that one and that one that's where those two packets line up in the trace so as you go through you're now lined up and you can keep doing that you keep doing that this procedure over and over again it's depending on your protocols how chatty they are how many times they perform the same functions sometimes i'll mark each one each time i do like a tree connect or an open file or whatever do that ip line them up mark all those so as i'm analyzing on both sides of the trace i can kind of keep those lined up in my head um so yeah so that's how you the best
part that's the best way to kind of line up your simultaneous trace and again it's going to be a matter of looking at who's having the delays why are we seeing deltas why are those increasing on one side or the other um sometimes you'll get a packet delivered really speedy that box will sit and chew on it for a while and then send it slow back after a little bit or it'll send a response really speedy and the and the client doesn't see it for a while it's all about narrowing down your next step troubleshooting like i said you're not gonna see a smoking gun every time but you will get it narrowed down a bit
i wanted to jump into file extraction because that's a cool thing that folks like to do i'm going to use that ctf from from st connegan so inside this trace there's things that happen i know what's in this trace because i've got obviously gone through the ctf but i know files were transferred i know that actually occurred so i'm going to go here to file and export objects and then based on protocol you can actually export anything that was transferred over those protocols during the trace so just for funsies let's click on samba
and then i just go change the size and during that time someone transferred this mp mp4 file on our on our network now can i save that you bet i can and save that and just throw that to documents save that and there's the file i just ripped out of the pcap that works for smb you can over http super cool super handy one alternate way i want to show you to do that same thing which i think is a little bit easier he's using a cool tool called network miner fire up network miner we're going to open that same peak app no we're not going to update in the middle of a presentation that would be
bad open up this it's going to go through and parse it network miners are some other cool parsing stuff for you um it'll have all your hosts and you can filter down on those um it's going to fire that up
cool and then i can click on the images tab and here's every picture that was transferred during that session and nice easy thumbnails now let's say someone has a silly uh web service and they're just dumping credentials on clear text well we get those too super cool tool um here's everyone's dns queries where they're all going who's making them all that fun stuff network minor is super cool tool you can use especially if you are um just have a network tap somewhere and you just kind of keep an eye on what's going on let's say you're worried someone's exfiltrating data throw a network tap on have network miner on there have a quick look of see what's going through super
handy for from a blue team perspective um those are kind of the main tips and tricks i wanted to show you i and a lot of this is like question answer and stuff so what question does anyone have in the whole world of pcaps for me if any and i will do my best to make something up for you
everyone's like yeah please go ahead i i heard something with us aside sorry okay so you're going to run into some issues especially anytime you're doing security stuff on sso because it's going to be encrypted you're going to run into that so you're going to have to do expert exportation of your keys to be able to have a look into that but one cool thing that i'm glad you brought up is in the world especially if you're on a linux box in the world of linux a lot of time when application one application is talking to another on the same host that's talking via sockets just internally to itself in that tcp dump command that i
mentioned if you on your interface do lo your loopback interface you can actually see applications talking to itself on the same box just different just different demons talking to each other so on a state where you're trying to like troubleshoot an sso problem and it's this box is talking to itself super easy ways to do it you don't have to worry about certificates because you're already on the box so kind of a cool way to do that
cool if there's no other questions that'll do it for me thanks so much
you
Related talks
 51:37
51:37 56:31
56:31 38:01
38:01 33:46
33:46 53:27
53:27 38:43
38:43