What the deuce: Strategies for splitting your alerts

Show transcript [en]
on what you should be investigating in the network a little bit about me spent about ten years in the Air Force a little bit time at the intelligence community primarily a software engineer by trade and did a bit of network analytics spent most of my time analytic network traffic analyzing network traffic looking for malicious actors as they move through networks laterally in across lands and stuff like that Chris so I'm Chris like John former military a little bit of time in the intelligence community and sailing on Navy ships currently I'm a threat researcher and analyst at efflux and I work with a data scientist to build our automated analytics right now so I enjoy doing a
lot of threat emulation like John what we're gonna talk about today is a kind of this concept of actor intent and how their their realization of their intent is actually what causes the business loss to companies and organizations and kind of a abstract way to determine if they have intent in your network versus just having some kind of malicious code or malware or annoying SPF to boil and in your network that's something is flagging on is malicious we're gonna talk a little bit about a proposal on a new way not a new way but an interesting way to collect a very specific telemetry to help illustrate this concept of intent go through a couple case studies on some
recent recent presentations and recent reports that were released earlier in the year talk about how we did a the technical technical execution to demonstrate this and then kind of show the application of what it is work we're doing so bottom line is that defender should target threats that have intent business loss doesn't usually just come from the fact that something Bad's in your network it comes from the fact that there's a human on the other end of the line who's trying to do something right and and you know whether it's PII or intellectual property exfiltration as of recently lots of ransomware and mass ransomware distribution you know what most of you probably familiar with San
Fran this point and of course downtime but downtime it takes a way to take the system's down do incident response and bring it back up so the main takeaway is that well we try to try to emphasize with folks we work with is you should try to find out if the actions going on in your network are going to lead to something bigger the one way we look at doing this is looking at post exploit if 'ti and once someone gets in your network they're gonna come back if they give a crap if they don't they might leave it there for a while they might do health and wellness checks they might just babysit implants looking for the
right time to come back in most cases we find lateral movement is always required to get to where did you're going right and there's a lot of discussion and talk about lateral movement but where I find is there's kind of a lack of making that link between lateral movement is usually a precursor do some kind of intent that is going to come into fruition and impact your network right and in today's day and age actors are living off the land right there's PowerShell there's WMI there's everything that they need built in to move around stealthily or is it stealthy just goes no one's auditing every move they make using those tools or is there a lack of collection some of
the things we kind of want to explore so what we say by split your alerts is not like splitting stocks to make more of them is to split them into priority queue right and so our core philosophy here is that you should focus on your events your investigations that involve lateral movement as they often are indicative of actor intent and then everything else comes priority most stuff that you're gonna deal with might not have lateral movement that's fine but you need to be thinking about how do I detect it how can I react to it around the clock for the couple times that does happen so this gets into the kind of how we want to do this and how we propose to
do this is this telemetry collection of kind of answer who went where when using what two types of telemetry that we are really interested in trying to automate the collection and multiplexing of is Network telemetry and endpoints Lum tree so I love network Kalama tree I love Network analytics I think it really answers the question of lateral movement right if you can collect traffic from you know even as low as your access and distribution layer in your network you can kind of have an out-of-band collected data reference that illustrates where every computer is talking to in your network right and of course if someone's moving laterally in your infrastructure they're going to have to use network
connectivity and then you have that steward somewhere granted it is a haystack and you have to extract it out of there but this is where we want to get into combining additional telemetry to enrich this this base forensic set of network telemetry I'll let Chris talk a little about the endpoint it's not like John was saying what we want to try to do is tie the endpoint side into the network side and network side being the ground truth of where someone went well we see a lot in endpoint tools as well they might monitor something like a network connection that'll give you a five tuple or something you can pivot off it's not their primary focus they're looking at
things like loaded module what files were to access things like that so it's fusing those two things together like John mentioned a a trusted source like like out-of-band collection and infusing that with things like what process were they using what is the checksum of that file what event logs were created those type of things play into the endpoint telemetry and we put those together like I mentioned off of five to four or if maybe you just have a timestamp and an approximation of what a process should do sewing those things together it kind of builds our telemetry pattern which I'll show you in a minute yeah so the whole idea here is instead of storing
some of this key telemetry and their individual silos can we combine them either on the fly or retro actively so give you some kind of master record this is a JSON blob that resulted from the data set that we're using and it's basically a combination of layer three for NetFlow data that has been actually Recession eyes based off the tracking state combined with a bunch of endpoints limiter that we actually pulled off a carbon black so this includes the bid the command-line invocation the process path a bunch of other goodies that we can send into something like elastic search or solar now you have this pulley queryable set of traffic and processes that you can audit for the lateral movement all
using friendly certs and taxes like leucine so we'll go through a couple of examples we'll start with the baby example and we'll move on all there was a recent report out from Intel security about distribution of the same same ransomware bottom line is that you have a web facing server maybe with a web shell or something that gets compromised and once they're on there they gain the credentials they need and they invoke something like csvde and this specific in this specific example what they did was they used that to dump all the computers out of the oh you forum Active Directory loaded that into a file ping the ones to see which ones responded and then they passed the
Sam Sam ransomware up there with the copy command and then PS exec it you know they renamed the PS exec executable something else because for funsies thinking that's going to maybe stop someone auditing PS exact I don't know why but good for them this tradecraft can be used basically to distribute anything across your network right here so happens they're looking to do it from a ransomware perspective so thinking about automating the distribution and launching of ransomware using an automated technique like this as we were starting to see more and more could be extremely damaging to the operations of the business so our theory here is that the traffic collection if you can merge it using this kind of data
set here you can simply say hey show me all the traffic that's generated at PS exec now since they're super stealthy and renamed it maybe we can use the md5 because we'll have that from our endpoints a lemon tree merged in and kind of get that network map of saying here's where the distribution of this particular binary went on the network and then of course you can kind of extend this by doing some you know hash tag data science or hash tags justice statistics on kind of recurring patterns in your network to see if this is normal usage and I'm gonna hand it off to Chris to kind of go in over a more advanced
example so many you guys have seen this talk from the mandiant guys the derby candidates MOOC on pretty much all over the place very interesting for each that they presented on they recently called out as apt 29 or cozy bear so a variety of tactics including you know deception techniques just a really fascinating talk if you get a chance to take a look at it so what we're seeing that we think would be interesting for it's a lemon tree perspective that could have put this together quicker is the PowerShell usage and they didn't use winix pacifically they use PowerShell down but they're WMI commands but tying those things together and looking at these things in telemetry sense we could
see something like PowerShell connecting to another victim host watching something like the WMI process which will then spawn another powershell you put those things together from a network perspective and now you can tailor where you actually need to go and then you look for other maybe they're putting down one of their they mentioned their advanced backdoor and then they're their basic backdoor you follow that process stream you can see exactly where their lateral moving and so kind of as the counterpart to what john mentioned with the Sam Sam stuff we want to ask as an instant responder or defender show me something that involves WMI and PowerShell show me what that graphs out see where they went and then the network
traffic will kind of connect the dots for you there so how we kind of pieced this together we're fortunate enough in our lab that we have a partnership of the carbon black so we just went ahead and used their stuff to do our endpoints lemon tree collection a few other tools out there that folks can use as well we're evaluating os query although it's not a real-time streaming of telemetry it does give you the some of the information you would need sis mods another good tool that were actually playing with as well and using that that actually logs all the network connections and an endpoint process launch or a process would make and then also can track process launches
so and then from the network telemetry side we're using an open source tool called Argos Argos is really cool in the sense that it actually maintained by directionality gives you a sense of what the state is that allowed us to actually kind of recession eyes so we're not you don't have massive amounts of flows for a single session we can kind of keep a single session object together and what we did is we kind of just orchestrated these two tools not sure we have a carbon block users in here but you have a way to basically they provide a way to siphon off the raw sensor events from their endpoints and pretty much you know
you have to pay attention to their backends collection analysis you can actually this just a raw google protobuf you can parse it and then dump it and so we dumped all the stuff into just a log file in JSON format and then with a couple lines a patchy spark we were able to basically parse all those JSON in into data frames in memory where we just run basic sequel commands over it so sequel joins all day long to pivot off of the five tuples parse off of the pids in the process launch times and then we have that that results in that master JSON blob that we showed a few slides back and we send that bad boy in of
elasticsearch and then we can use cabana on top of that so actually first of all do full text queries on whatever you want we've experimented with doing dashboards you know show me every hour approximate launch information for certain types of processes that are native to your native to your organization native to Windows and then from there you can actually build really cool visualizations using the graph plugin so this is the Sam same distribution that we use with the built-in graph plugin for cabana since they're super awesome and renamed PS exact we just kind of yanked out at md5 of a PS exec version and we're able to sequere this so this is the graph that comes back
from a simple search on this md5 no fields no nothing full-text search because we're using elastic search and what what we get is this graph that has a pretty pretty dense centricity on that Center 10 10 4 6 in the middle here and what we did is we added three different types of vertices source IP DES type E and then the command-line invocation of processes and so what you're seeing on those teal blue teal greenish tags is the actual command-line application that linked these nodes together right and so when we actually cuted our PS exact to launch it these are the four victims that we launched it on right so this is a single query that gives you a topology
graph the kind of show is exactly what was going on on your network so these are the kind of things you can automate and run over and over again right from a threat planning perspective can be really useful to to kind of audit this kind of behavior right especially when you start to see dense clusters like this unless it's normal for users to pass this kind of stuff around your network again something you might be able to model and normalize the bottom right kind of shows the exact that was logged from our end point collection was firing off samsam dot exe we didn't actually do this to ourselves I think it was like renamed calc or
something so it was the great calc attack of 2016 in our test Network and then this next slide will actually show the kind of a be t29 type activity so let me start out by saying that I didn't do any p229 justice here there's a lot of not so stealthy things I did on here but one of the interesting things going back to the mandiant breach as they stated that sometimes their initial compromise would be a lot more noisy than the lateral movement that you'd see later almost as one of those deception things oh we got it under control they neutralized that box we got their backdoor it's all over until it's not so not not entirely on their own
possibility so essentially what we have here is uses a Power Cell to start off you see our friend 10 10 4 6 there happens to be a forward-facing web server with that has we use the web shell to execute power shell and download some tools with some very stealthy names there on the bottom right and then from there once we got up on there we went did cSPD recon again and then from there moved on to 1010 450 one of the reasons I say didn't do a PT 29 justice because we've got PS exec running on there pretty obvious thing similarly WMI my suspicion based on looking at the breach notes they were probably tunneling that power
shell that power shell stuff through one of their back doors or through another process so they wouldn't see necessarily these WMI these clear command lines of what's going on however if you had like we have these bad backdoor names here if you knew is tunneled through bad XE you could pretty clearly search for bad XE and follow the tree all these network connections to where they're actually going so just an example of a little bit more complex lateral movement breach so future applications that we can kind of see of taking this kind of telemetry set first one is alerting right everyone who is a network defense has some kind of alert queue or some kind of work you
they sit down and say here's what events I'm going to investigate whether it's specific types of logs in your log aggregation systems where I investigate you know massive amounts of failed login attempts or you have something that is doing kind of that next-gen AV role where it's it's identifying host I have really anomalous behavior a lot of the newer vendors out there have you know advanced analytics using different types of machine learning models to try to identify anomalies to accelerate threat hunting the whole idea is here is you have like in this master transactional record of processes and the network traffic they generate can I say look for every alert that I have let me query my master data
set and immediately try to investigate it there is some kind of host or pre alert tradecraft and specifically lateral movement as we want to really zero in on that as again our core thesis is that lateral movement means essentially you know winter is coming if they are successful in what they're doing and you should really be in a lookout for that hunting value there right you can hunt by query seems like a really great thing to us I think the industry kind of did went from a threat hunting perspective kind of went from a crawl to a full-out like Olympic gold-medal sprint with all these machine learning tools that are out there combing over massive Hadoop data sets
and all that stuff right but what if you can just kind of take your data set that it's good enough and just query for things hey show me daily roll-ups of PowerShell WMI you should show me can I basically track where my administrators go in the network and then when I see someone doing something that looks like an administrator and they're not an administrator I can start to investigate that from a hunting perspective and finally an incident response working with a lot of incident responders I'm getting the full picture quicker is something we've been we've really valued working with them on on they spend a lot of time drawing things out on whiteboards kind of collecting data and
all different different fields that they can oftentimes they don't know the environment they're in so will we advocate for with a lot of our customers and clients it's like look and you get a base level of really good collection you know almost like a DDR of this this data set so when someone comes in they can be like oh cool I have this awesome data set I can just query to do whatever I need and then uh some food for thought really for we're thinking stuff so for those of you who aren't familiar with the hacking team breach you can determine whether it's a work of science fiction or whatever but essentially what what went
on here is a gentleman claimed to compromise the hacking team Network and he kind of laid out on pastebin and how he did how he used all these tools so this is kind of one we don't have all the answers to how do you make this telemetry in a mixed environment like this the quick summary of it is that he compromised afford facing embedded device and then pivoted from their first on to a backup server looked at a share which he didn't or a MongoDB that wasn't very interesting and then from there use used stuff from the backups to pivot into the domain environment and as you see there we kind of all know what
happens when you get into the domain environment there's two of the things that we just presented these you're living off the land tools copier your files everywhere and it's pretty much game over so what we were kind of thinking about is how do we catch this when it's actually happening with just an nmap scan or is there an agent that that runs on unmanned go or on your on your docker container that's running and then it's business data moves to the cloud because it would be nice to say that all of our business critical data is in our network more and more we're seeing that move out to the cloud what type of agents are we running there
is it out-of-band collection like VPC flow logs or other things that we have to use to build this common telemetry that we can use for Incident Response whether it's on Prem or in the cloud so this like like John said this is food for thought this is this is things to think about because I think we're only going to see this transition accelerate going forward so challenges in this and kind of a way ahead as we see it I think there's a big a big wide open space for security by telemetry and what I mean by that is if you can collect the right data set ask relevant questions even simple yes/no questions to start you can
kind of get ahead of the game right a good question is WMI being used today if I know it's not nautically normal in my network bad question to ask am I hacked I don't I don't know like figure out the small things first piece it together to get something bigger I think a lot of other tools out there try to jump to that question especially some of the other vendor tools where it's just a magic magic box you plug in and it pulls your ingress/egress traffic and then it spits out some kind of answer that says oh this host is totally hacked because they did something anomalous because someone is running Spotify like maybe not maybe
it's a lot of false positives but what is the use of it when they take all this awesome telemetry in themselves and then they dump it because they're just spitting out the results of their analytics I think there's a somewhat of an industry issue with the fact that a lot of the industry tools that folks pay for don't give you the raw telemetry that they have and some of it could be really really useful telemetry if you could just store it and merge it with the other telemetry you have the SAC ops data set should be a core data set that you can use to rapidly answer questions right lots of logs have to be collected
and stored but they're not necessarily relevant for day-to-day security operations so are you know we'll be advocate for it don't settle for existing data if you need better and is also challenging right it's challenging to work with the IT the IT members you know have to maintain these systems and enable the net flow or the J flow or whatever tools are out there to get this kind of network telemetry but if you can get it and start maybe in an area of your network that is sensitive than others you can kind of start to log that and start to build this base I need my go to you know my go to drink at a bar
is like a you know a bourbon club so sometimes I would or something crazy right and that's something crazy it's maybe something I have in kind of a colder storage right but I know that I had this go to base data set oh I talked about sis Mon it's a really awesome tool that came out a couple years ago that is really good for auditing all the stuff that's going on your windows hosts that is a word that is a way to kind of collect the net flow telemetry in compliant with that to give the kind of a same data set right because if we can do this all with open source and we're empowering people even more and then
finally harass the crap out of your vendors being someone on the vendor side as well I get harassed and so I like getting harassed because that means we can build things that people want in need and I've seen other vendors love getting that kind of brutal harassment says yeah this is really cool but can you just give me this in status and especially when they want to get under the hood and say can you just give me this raw data some folks are some pretty responsive to that and you know don't settle for having to use the data you have don't macGruber it together and I think that's basically it any questions sure so a
question was if we're getting like 5-tuple network connectivity out of the out of the end point itself why do we need to overlay with flow we found two big things there one of them being that mostly we just get a five tuple and we can't really get any other information about what the session looked like and so we've done we've got a lot of use out of like saying volume like how much traffic was actually sent over these connections where we can kind of sum it up in the the enough load data we can actually get how much that it was sent received we can get durations and we can also revert back to the actual raw flows
themself and kind of map out what the session looked like over time looking at you know you kind of look at the session life span and look at well how much was sent received over and determined in an interactive type session is it a full file transfer obviously you get context that way and also because of these blended environments actually back to one of the previous ones we had on when we did there were pseudo replication at abt 29 where we actually set up a binds backdoor is that we actually connected in from another host to that backdoor that didn't have endpoints a laboratory on it but we could kind of pivot off of that because you're if you're collecting
endpoint or excuse me network telemetry higher up you might get a more bang for your buck with a single collective than you would at endpoint agent all right well thanks a lot and enjoy your lunch
Related talks
 1:05:41
 30:35
30:35 34:04
34:04 52:47
52:47 41:38
41:38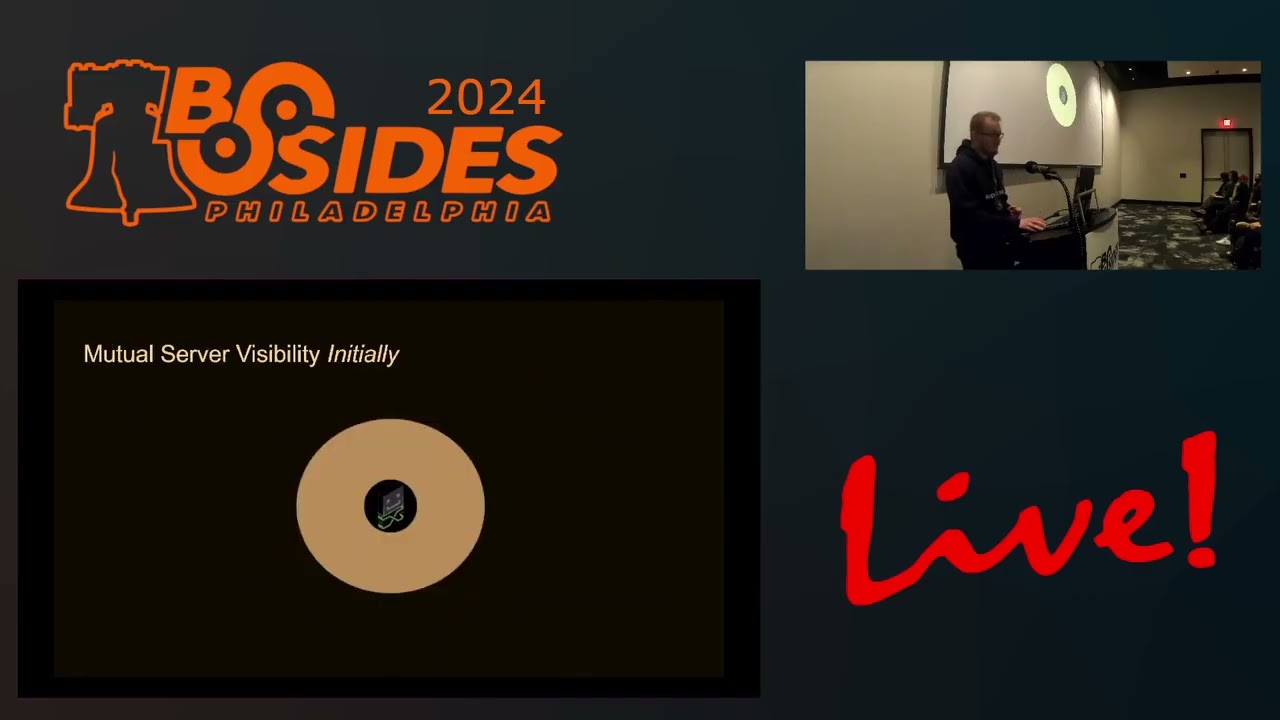 33:12
33:12