Writing Windows N-days
Show transcript [en]
hey everyone thanks for joining us on uh track two of b-sides boulder today um so our first talk for today is going to be beau pierce who's a security consultant here in boulder his talk writing windows end days will demonstrate tools and approaches used to find windows kernel vulnerabilities and design exploits i hope you enjoy
hello and welcome to my talk my name is bo pierce and the title of my talk is writing windows and days before we begin i'd like to tell you all a little about myself as i mentioned before my name's beau pierce i'm a senior architect at a local security company here in boulder in my free time i like to do research in windows and days research into bug bunny programs i have a few certs the oscp osce and the cka if you're interested in any of the work that i've done you can check that out on github linked here or follow me on twitter as well as check out my blog where i have blogged
about a few of these topics that we're going to cover in the coming slides of this talk some of my publicly available research in this space of writing windows end days are the following you can check out these on my github or on my blog cve 2020 1054 which is a local privilege escalation cbe 2020 1015 which is also a local privilege escalation then you can check out 2020796 also known as smb ghost that's a remote code execution but in this context it was just done as a local privilege escalation and then finally cbe20190708 or which is more normally known as blue keep um and that's a remote code execution so the the talk agenda is basically
we're going to be looking at three different windows vulnerabilities and different levels of detail these will be blue keep 20 20 10 54 and 20 20 10 15. while we look at these i'll demonstrate approaches and steps that are used to identify the vulnerabilities as well as write the exploits during this process we'll highlight some of the tools used and just general approaches that might help you get into writing windows end days if you're interested the overall goals of this talk is to encourage people to write end days and research public cves for either defensive measures career and personal growth and most of all just enjoyment because it's really fun and i really really recommend getting into it
at the end of the talk i hope that the listeners will have a general idea on how to approach writing a windows zen day from scratch so what is an end day people are familiar with the term zero day they kind of get all the hype but what exactly is an end day well first let's start with the definition of a zero day this is an exploit that takes advantage of some security vulnerability that is unknown and it's referred to as a zero day because the relevant parties have had zero days to mitigate the vulnerability before active exploitation this is in contrast with an end day which is a publicly exposed vulnerability either through some security advisory or
through a security researcher the end comes in because the relevant parties have had end days to mitigate the vulnerability before active exploitation so why would you even want to exploit an end day well first off because it's fun it's really good time to get down into the into the weeds and see how you can manipulate the flow of a program to do whatever you want essentially to learn it's it's really helpful to write these end days because you have a basis to start from and you can understand how modern exploit mitigations work as well as how common problems that you may face while developing exploits and also from the defensive side you can if you understand how
the vulnerability works you can develop attack indicators and indicators of compromise that may help you protect your organization or the organizations of others better and then finally the impact which we'll get into more here so the impact of end days zero days are you know really sexy everyone always wants a zero day because they're super cool if you have one you can essentially exploit any of the affected software and nobody has really any defensive measures against it but in terms of impact end days have a real large role in security for example eternal blue which obviously was a zero day at one point but by the time it was actively exploited the the patch had already been released for
over a month so in this sense it was really an end date because relevant parties had had you know at least a month to patch their systems by the time the shadow brokers released the exploit code in april 14. eternal blue variants are estimated over 14 billion dollars in damage which is obviously insane another end day that got decent amount of tension just within the last year was 20190604 which is a microsoft sharepoint remote code execution vulnerability we can see here the patch was released february 12 2019 and then by may 11 2019 there was active exploitation a third that you all may be familiar with was 2019 19781 which is a directory traversal and
remote code execution on citrix application delivery controllers this was the patch was released december 17th 2019 and then there was active exploitation by january 10th of 2020. here's just an interesting graph you can kind of look at when the first exploit was released on github and then active exploitations or indicators of attack based on a honeypot somebody set up so basically what i'm saying is the end day stocks are rising and it's it's time to get in before before they go too high so end a exploits from a high-level approach and this is just my high level approach that i use and i think it could be helpful to people trying to get into it
but first things first is it can take a lot of time to write these exploits and sometimes it can feel really challenging and maybe even impossible but just keep trying i can't even tell you how many times that i've been really down never thinking i'll get it and just never giving up and eventually eventually you figure it out and also break try to break everything into small steps when you look at a finally completed exploit and you look at the code and you know there's all this binary and all this all this hex and a bunch of lines of code it can look really daunting but in reality these exploits are all written in small small little pieces and putting
them each into their own small piece it makes a lot a lot more simple so don't look at a finished exploit and look at the whole thing and like oh wow that looks challenging in reality know that these are all done in small steps that are actually quite manageable but if i had like a five point strategy for writing these end day exploits it'd be kind of laid out like this first you want to understand the basics of the vulnerability you can achieve this by doing patch dipping crash analysis and reversing once you have the basics of the vulnerability understood i typically go into writing some code to hit the vulnerable code path so this is this is important because
yeah you have a vulnerability but you may not even know how to hit that code so hitting the vulnerable code path is definitely step two i would say after that i typically like to create some proof of concept crash so this exploits the vulnerability in a rudimentary way that doesn't really you know take control of anything but shows that we can write code that will that will hit that bug after that i really start just expanding upon the fundamentals and determine the primitives and how i can control the vulnerability so this will be like live debugging and more reversing and then finally when i really understand the the security bug i develop an exploit strategy
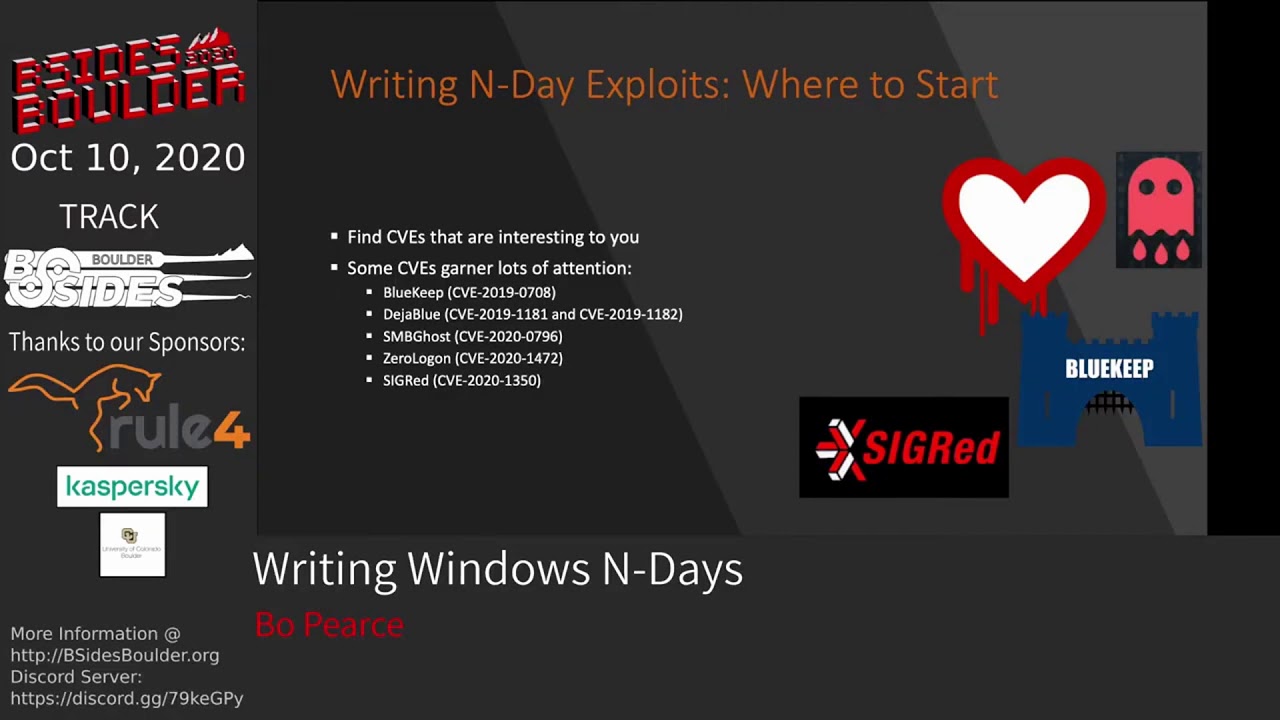
and write that up so if you wanted to write a windows ending where where would you even kind of begin first off you need to find some sort of cve that that looks interesting to you some cves garner lots of attention so they're obvious candidates examples of these are blue keep deja blue the the following up rdp vulnerabilities smb ghost which was kind of in the vein of eternal blue is a remote codoxy execution for against smb zero log on which i'm sure you guys are all quite familiar with now at this point because it's dominating a lot of the news right now um and then cigred which was a dns vulnerability you can also tell if if the
vulnerability has uh some graphics that's probably probably pretty serious as we can see here so where do i typically start when i'm looking at writing an end day i really kind of just go to zdi's monthly security review it's my primary source of information every patch tuesday that windows has their patch tuesday they'll release this table that goes over each of the new cves and then provide some details about them so here we can see the level of severity if there's a public exploit already available if it's being actively exploited as well as the exit latest and xi older scores these are microsoft's exploitability rankings so essentially how it works is the lower the number the easier it is to exploit
so something that is two is potentially exploitable but the the bug might not be super reliable whereas something that's one will be more easily exploited with a more reliable opportunity so typically i'll go through here look look at cves that are interesting and then try to find one with an x i of one and then kind of go from there in my experience there's typically three kind of normal starting points when you're approaching an end and we'll go over those here so the first one is just from the msrc security advisory you can see here this is one for cve 2020 1015. it provides some information on on the vulnerability not much but from here we have an idea of where
the vulnerability might might exist then start coming up with ideas on how to to determine what it is another common starting point is from provided crash code so who provides crash code it really depends but in some cases when these vulnerabilities are found by third parties they'll include their proof of concept crap crash code also you could easily see crash code on github 4 for some sort of cve that hasn't been fully developed but maybe you can take that crash code and complete the exploit and the third common one i see is crash analysis provided by some third party that's interested for example here is a small picture of some crash analysis analysis by zdi
for the blue keep exploit so these will sometimes be included with the public disco closure of the vulnerability typically they won't have any exploit code but they'll have very detailed analysis of why the the security bug arises and typically how you might be able to hit that vulnerable code path you can also see these and the google project zero write-ups is a great stuff great spot for the same starting point so we'll be looking at three different cves through the course of this talk each corresponding with one of those starting points i just mentioned and then going over some of the tools and approaches that you might be able to utilize from that starting point to give you an idea
of how you could start writing the exploit and doing research on it so the first one will be cve 2020 1015 this will be starting from an msrc advisory then we'll move into 1054 which will be starting from provided crash code and then finally blue keep or cbe2019078 where we'll be starting from a zdi analysis so let's just jump right into it with cbe 20 20 10 15. so we can go get the msrc advisory it's readily available on their website on every patch tuesday which will detail some of the details of the vulnerability so if we went and looked at the the page for 20 20 10 15 it would basically read this an elevation of
privilege vulnerability exists in the way that user mode power service umps handles objects in memory an attacker who successfully exploited the vulnerability could execute code with elevated permissions along with this we'll get the the kb number which details the patch that needs to be installed to remediate the vulnerability as well as which windows versions are affected overall this vulnerability is a race condition that leads to use after free after doing some research and if you're interested in going into this vulnerability in more detail you can look at my blog or my github which has some code for it so looking at this advisory it's obviously not super detailed so and we don't have any crash code or
any other analysis from any other parties to help us get started so really the only way forward is doing some sort of patch stiffing the first step obviously if we're doing patch devin is figure out what is the actual file that that has been modified between the vulnerable version and the new patched intermediated version so depending on what the affected service it may be more obvious but in this case you know you could just search user mode power service dll and here we come up with ump dll and that's you know probably the file that has been modified so what are some of the tools that you might use to actually do some patch stiffing
so really there's two primary ones diaphragm or bindif both of them require ida pro which is obviously can be kind of an issue essentially both do the same thing and the output is very similar however i prefer diaphragm i think it's it's i think it's a little bit better a little less buggy from what i've seen so the first step of patch diving is obviously to obtain a copy of the old version of the file as well as the new patch version of the file so you can diff them and see where the changes are the easy way to do this is just simply use the microsoft update catalog you can search the kb that's specified
in the advisory download that and then you have the the new patch version to get an old version you can either download an older kb or what i typically like to do is use some vm update it to everything right before that kb has been applied grab the copy of the file that way you know that this older file is the most new version since the new patch and that's important because when we're doing diffing we want to minimize all possible changes that aren't related to the security vulnerability so before you can actually use diaphragm bindif you have to extract the patch from the microsoft kb dot msu file that you downloaded so it's really simple
you essentially just use this expand exe command to extract the dot msu into some directory you can then use it again to extract the extracted cab to another directory and then within that final directory in this case which would be patch you'll have the the new updated files if you want more information on this i really suggest checking out this resource it's pretty new it was posted sometime this year i just came across it recently and it's it's super super good cool so say we got the older version of the file and the newer version of the file and then we run it through one of the patch diffing tools the typical output will be something
like this so this is running it from both versions of umpo.dll what we can see here is running it through diaphragm we have two different functions that have been modified and of course it's not always so simple a lot of times you'll have a lot more modification in between the two files which will make it a little harder to narrow down where exactly this is the new bug is however in this case there's just simply two modified functions we can see umpo notify register as well as rpc legacy event register notification the important parts in this table to look at really are the ratio the two ratios that will show how much a file is
modified from the older version so if the ratio is one then there's zero modifications so this has 0.91 which means that there's been slight modifications whereas the second function is a 0.65 meaning there's been more modifications after running that and looking at these different functions you can then both of these tools diaphragm bendev have the ability to view the changes in a few different ways for example we can look at a side by side of both the files in terms of assembly so here we have each of the the basic blocks and we can see how there's been modifications
diaphragma has another really useful side by side which is dipping the pseudo code of each of the files this can come in really handy because it can be a little easier to just get your head around some of the changes before looking at the assembly what's really interesting here is you can actually see the security vulnerability in this side by side of these two of these two divs for example if you look very closely at the the left side you'll see this variable v7 equals umpo git setting entry which is the old file and then on the new file with the green we can see before umpo get setting entry is called there's a call to enter critical section
what this is essentially what the 1015 vulnerability is is a race condition because we're not entering critical section before accessing this umpo git setting entry get setting entry is a global variable that can be acted upon by different threads so essentially you can exploit this this bug by taking exa taking advantage of a race condition which leads to a use after free so i just want to highlight this because it's it just shows the power of diffing i mean you can literally see the vulnerability right here seeing the changes in the code gives you an idea of what's changed and and how you might begin approaching writing an exploit for it so after the patch dipping we
you'll always obviously have to do reversing of the modified functions to to figure out what exactly changed and why those changes resolve some sort of vulnerability so once you've determined how how that might work you know next steps would be how would you hit that vulnerable code path and how do you exploit it in a rudimentary way and then try to test that with the proof of concept so we're not going to go too much into this vulnerability because as i mentioned it's a it's a race condition that uses leads to use after free on the microsoft exploitability index is a ranked 2 which means it won't be the most reliable exploit at this point when i was doing research
into this vulnerability this is kind of where i stopped i have the proof of concept crash code that that takes advantage of the race condition but never to pull up the exploit further after that so now let's jump over to 2020 1054 which starts from the other typical starting point in my experience which is starting from a third party advisory that provides proof of concept crash code or from some github account that has a proof of concept crash for a publicly known cve so from checkpoints advisory was essentially this a right is made which allows out of bound right and might lead to local privilege escalation so i took that and indeed it does that
out of bounds right can be taken advantage for to do local privilege escalation the the whole entire deep analysis of this vulnerability is available on my blog which i recommend reading if you're if you want to see a little more in in the weeds of this exploit the proof of concept exploit is also available on my github what makes this exploit really cool for me and why i really pursued writing a fully functional exploit is because it affected windows 7 and as i'm sure you all know windows 7 no longer receives any patches so essentially this this vulnerability exists in all versions of windows 7 since its inception so you know it's basically a free
escalation of privilege going forward indefinitely so looking at the proof of concept crash code this was provided by yo of allen and natanel ben simon from checkpoint research they do a lot of really cool research and have a few talks on how they find these vulnerabilities through fuzzing the windows kernel that i highly recommend you guys check out you can just google their names and you'll find it for sure but here's what the proof of concept crash code was that they provided it's super simple we can see here there's a create compatible dc call which creates some device context we then create a compatible bitmap with with some arguments we then select the device context with a bitmap and
then we draw an icon with some more arguments and essentially these calls enough are enough to cause some crash and out of bounds right within kernel mode so if we just run the code obviously we're going to get a blue screen and this blue screen is not actually from running that code it's just a random picture but you know so how do we start from this proof of concept crash code without just blue screening our our target machine the way we would do this is doing some kernel debugging and using the windows kernel debugger so a typical process and if you google's setting up kernel debugging though there's a lot of things out there that
i'll be like oh you set up this debuggy vm and a debugger vm and you set up a com port in your hypervisor and then configure some more things and set up bc edit with the correct bottom port you boot the vms in some magically specific order and then you debug the kernel at completely slow rates that will make you want to go insane and you may just die at your computer waiting to print out some memory from the stack but you can do that and it is definitely one way to do it but that's not really the recommended way i would say there's a lot easier way to do it and that is this quick and easy kernel
debugging using one of these two tools so the first one was virtual kd which basically allowed you to do kernel debugging super simple it's a little outdated and doesn't work with all the newer versions of windows 10 as well as some of the newer hypervisors but there's this awesome repo virtual kd redux which is taking you know the kind of moving forward with virtual kd on on newer software versions you can get set up kernel debugging with one of these tools and you know less than five minutes essentially all you do is and install a monitor on your host machine and then install one uh one thing on your machine that you want to debug and
reboot and you're essentially already kernel debugging and it's so much faster than debugging with you know some sort of com port now if we run that same crash code while we're debugging the kernel we get this beautiful stack trace which shows exactly where where the code is crashing we can see here some tri icon ex at offset oxd9 along with a stack chase we get this really helpful information about the state of the registers and the state of the system right before it crashed we can see here it says invalid system memory was referenced the invalid memory is arg1 and we can see that that lines up with the register rcx so essentially we can see that
that's where the out-of-bound right is occurring and then we can take this information to start digging deeper into the security vulnerability and how that register rcx is set to that value and how we might be able to take advantage of that out of bounds right to do some local privilege escalation so you could do a whole entire talk and more than that on when dbg and kernel debugging so i don't want to get too much into that but i do want to point out some things that i find extremely useful to use while debugging security vulnerabilities and looking for how you might exploit them and then you can follow up on this on your own time to to delve into it a
little more but first off read write break points super useful if you have some sort of structure or some sort of memory that you want to look at and you're not entirely sure where it's being manipulated and exactly at what points you can put a rewrite breakpoint on it and then anytime it's manipulated it will break and you can you know start checking out what function that is and it can really save some time and reversing another thing that's super useful i find is putting breakpoints that print values and then continue execution like so for example this is how you might do that in one dbg it essentially would just break point at this v string right one at the offset ox
three f three it would print the esi register the eax register and then continue execution i find that useful just when you're tracking the state of specific registers throughout an exploit or throughout the run of a program you can just get those printed out continue execution and then you kind of have this history to look through also conditional breakpoints are super useful i find basically checking if some register has some value and if it does break this can help you know if there's some break point that gets hit a lot in in the state of this this system that you're debugging that can be really time consuming annoying to step through that all the time but
if you know that it's going to be equal to some value that that you're then interested in setting that conditional breakpoint is is really helpful also the when dbg scripting is is super cool it can really help automate some some things that you're trying to accomplish it's it's kind of similar to c and syntax i shall say but you can check out this link here for more information on that some next steps for this would be determining how the arguments to the parameters in the proof of concept code can be modified to control that out of bounds right and then when we understand that better we want to look at what are the limitations of where we can
write like how much can we control the out of bounds right destinations and then what are the limitations of what we can write we're going to kind of leave this exploit here because it gets really quickly deep into the weeds but if you're interested more i recommend just checking out my blog post on the on this cve and it goes into ex extreme levels of detail so let's get into talking a little about blue keep i was able to take a zdi analysis shortly after the security advisory was released and use this information provided to write a fully functional exploit that targeted windows 7 prior to any public exploit code release at the time i was pretty proud of this
because it was the first time i'd done any windows kernel exploits uh it was really my first end date ever and and to be honest it was the first time i'd ever opened windbvg and i want to use this as an example just to show that if anyone's motivated enough and just sticks with it they can do this as well but with the zdi analysis went over i can break down into essentially three bullet points which are if you set up an rdp connection with this specific virtual channel mst 120 and then you send data on that virtual channel you can free this structure that i refer to as a channel control structure and then once you disconnect the rdp
connection you will trigger the use after free a little more information on these virtual channels just to fill it fill in context a virtual channel is essentially just a a data channel that you can send information over the rdp connection so an example of this is there's a clipboard virtual channel there's a sound virtual channel just a simple bi-directional way to send data from client to server over the rdp protocol if you're more interested in just checking out this exploit code you can check it out on my github as well as a technical analysis paper that i wrote that's available on my github as well so some things to keep in mind when you're writing these end days or
approaching them is to take advantage of all the documentation and resources that are available to you so just to list a few of these on this on the right here we can see this picture and this is the the rdp connection sequence to establish an rdp connection between a client and server and obviously there's a whole ton of steps here and writing that code is kind of a pain but taking advantage of libraries rdp libraries that are available with open source code looking at the microsoft documentation seeing if there's any sort of relevant write-ups on the on the topic and then just taking shortcuts and writing our code so it you know it's not the best but it gets
us to our to our goal i think these are all useful things to keep in mind so one thing that we haven't really touched on with some of the last exploits that we were going over is reversing and reversing is obviously a super critical part of doing any sort of research on memory corruption end days so the main things that i use here for doing reversing is when dbg and then some sort of reversing tooler that has all the aspects that you need like a decompiler just assembler etc some of these common tools are radare 2 which is my preferred one then there's giga ida and binary ninja but you can just really choose whatever
is preferential to you additionally i want to put this on its own slide because decompilers are super super useful and i can't recommend them enough i feel like sometimes i get this conception talking with other people that to be super hacker you need to be reading the assembly like some sort of neo from the matrix but in reality that is helpful but using a decompiler to make you help make sense of the assemblies i just can't recommend that enough here's some of the the common decompilers that i'll use with radare 2 which is the jijo one and red deck from avast as i kind of just mentioned on that last slide you really want to just use all
the tools at your disposal when you're reversing to help make sense of what's happening so commonly when i'm doing some sort of reversing for a security bug i'll have three different things open here i'll do be doing live time dynamic analysis of the of the program as it's running with one dbg i'll then have like radari two's assembly pulled up in graph mode so i can easily track what's going on while it's being debugged and then i'll also have the decompiled code in some sort of text editor that i've pulled out where i'm removing extraneous portions and then just documenting the code with comments and then putting all three of those together it really helps draw a clear
picture of what's happening within the same vein of using all the tools at your disposal make sure you're using debugging symbols obviously that will help immensely also getting information on windows internal structures is is going to be super helpful when you're trying to reverse and understand what's happening within the program some of these places i'd like to check out is geoff chapel's website the github for react os which is essentially a re-implementation of windows xp and then recently just in this late september the win xp source code was leaked i haven't went through this in super detail yet but i imagine it's going to be a great source of windows internal structures and comments and things like that
going forward so returning to the blue cube exploit a little and how we might reverse what we need to figure out imagine we have written the rdp code client code so that we can establish a legitimate connection with the server and send data on this mst 120 virtual channel so the next step is determine how that use after free can be exploited first things first we just load up the affected file in our reversing software in this case i'm using radare as i mentioned earlier we want to get those when those windows debugging symbols to to aid us so you can do this in radari with just issuing the idpd command which will download them
and then we'll load them up with idp so our goal is to see how we can take advantage of this use after free so from the zdi analysis we know that this top instruction in the screenshot here i could find channel returns the freed memory so we want to see how we could use that memory to take control of the flow of execution if we just map how that pointer is moved we can see first it's moved into edi further down we can see edi plus ox 50 is moved to eax and then we have a call eax at the bottom so this easily shows that if we're able to fill the free channel control structure
with our own data and put this the correct pointer at edi 50 we will be able to take control of the execution and call our own code to help visualize this a little bit more we have i have this this great picture that has uh shows a little more information so essentially we free the channel control structure we want to invoke allocation such that the free space is occupied by our data and then at edi 50 we place it we want to place a fake v table pointer to our shell code which is then called by call eax so visually this would look like this we have this far left fake channel control struct that we allocate with our own
memory at edi 50 we put a pointer a fake v table pointer then we have a fake v table pointer that has the actual pointer to our shell code and then that will be executed to do this we need to find the correct allocation type where we control the size of allocation and contents of allocation because as i mentioned earlier the primary goal is to be able to allocate our own memory in that freed memory space of the channel control structure in windows kernel mode there's two primary memory types which are known as the paged and non-paged we want to make sure that our allocation maps correctly to whatever the channel control structure memory memory type is
so here we can see page non-paged and these are both in the pool the pool is basically similar to the like the user space heap to determine what type of what memory type we're looking at you can simply go back to wind dbg and put a breakpoint on the ikefine channel within the ica channel input internal function send some data on this virtual channel and then look at the the pointer that is returned from mica find channel so then we can use that pointer to issue the the pool command within wind dbg map that pointer to the outputs and pool and that will show us the memory type so here we can see the star here is what we're looking for
and we can tell that it is a non-page pool next if we just check the ms documentation we can see how non-page pool memory is allocated which is done through this function called x allocate pool with tag and then here are the three arguments the first is the pool type the number of bytes to be allocated and then tag which just helps debug so you can tag specific memory to specific functionality so a really useful thing when looking for indications of specific functions when you're reversing is to look at cross references cross references are essentially just mapping when one function calls another function or the locations that where one specific function are called so the first thing we want to do is get the
memory address of x allocate pool with tag which is an import so in radare 2 we just use the ii command with x allocate pool with tag this then gives us the memory address 16f34 and then we can use the axt command that shows the cross references to that memory address and it shows us all the x allocate pool with tag calls so one immediately stood out to me which was the ikea channel input internal which i've highlighted there that stood out to me because i know we already have substantial level of control within that function in terms of contents so if we look at our requirements again it's basically find a non-page pool allocation where we control
the size of allocation and the contents of the allocation so if we look at this specific call of x allocate pool with tag within the function we can see that the three arguments pushed to the stack for the x allocate pull a tag so we have the tag and then we have the number of bytes which is an eax and then finally the pool type which is in ebx now we can expect this xlocate pool tag with call a little more by just putting a breakpoint on it within that function and then sending some variable length data on the virtual channels we'll hit that breakpoint we can double check to make sure that this is the data that we sent we sent
all these four ones so we know this is this is our invocation into this function and then we can just check the stack to see the the arguments to the function before they're passed and we can see here that we have the tag which is highlighted and then we have the size which is 84 and then zero which is non-paged so that shows that this is a good allocation for us because we're allocating the correct type of memory if we send a few more variable length data and check the breakpoints we can also then just see we actually do have direct control over the size of the allocation so we know this allocation we can
control the size and it's of the correct memory type but the third requirement is can we control the contents of the allocation so a great way to check this would be to make use of the read write breakpoints so essentially after that that memory is allocated we can put a breakpoint on it here that you can see bar4 and then the address and then we can just continue execution once we get a hit we can then inspect that memory and sure enough we see that our four ones are copied into this into this newly allocated memory so this hits all of our main main points the pool type is correct it's non-paged we control the size and we control the
contents so this is a perfect primitive to make use of to allocate memory such that we take control over the the freed memory another great upside is that on windows 7 non-page memory is by default marked as executable so we can also use this same exact allocation to allocate our shell code so if we put this together the next steps to write the exploit would be to use the allocation to spray shell code such that allocates in a reliable execute location and then use this allocation to spray the pool to allocate space in the freed memory of the channel control structure we can then disconnect the rdp and trigger that use after free so that was some high level approaches
and i hope it was kind of helpful to get an idea of how you might approach starting writing some of these exploits or getting into their research but at the end i would like to show little tips and advice just that didn't really fit anywhere else in the talk which as i mentioned before keep trying the harder you try the better chance of success that you'll have read as many exploits as possible that are relevant to your target or maybe not even relevant and then just take lots of notes taking notes is super key i think when i'm doing this i'll track every single crash that's interesting track useful instructions and offsets so you can quickly reset breakpoints and
win dbg um which is just a great time saver and then heavily comment and all the assembly and pseudo code that that you go through while you're reversing what would be some next steps if you're interested in this i would say just jump into an exploit that's really the best way to to start learning more and getting your your hands dirty as i mentioned yo alon ben simone have have great candidates because their their advisories typically have some sort of proof of concept crash um check the zdi monthly patch information releases that i alluded to earlier looking at exploit write-ups is great as well the google project zero is probably my favorite general place to go to they have really
top quality write-ups and they typically don't have any exploit codes so you can use their write-ups to try to write your own exploit if you just want to do a little less of the reversing and more of the exploit development part then practice practice practice obviously the axis extreme vulnerable driver is really useful if you want to get into writing some kernel exploits and then just some general books that are i find really helpful in my experience is the windows internal seventh edition just to get a better idea of how windows works and then as well as a kernel program programming book by pavel yosovich which is also just a great book great thanks for listening to my whole
talk i really hope it was helpful on some level to somebody out there if you have any follow-up questions or would like to get in contact you can email me here and then i'll if anyone has any questions now i know we're short on time but i'll try to answer them as quickly as possible
thanks bo for the talk
Related talks
 51:24
51:24 47:43
47:43 40:48
40:48 47:32
47:32 49:19
49:19 49:43
49:43