A Better Way to Threat Matrix
Show original YouTube description
Show transcript [en]
My name's Cody Martin. I'm a Red Team operator with Black Lantern Security. Today I'm gonna talk about threat matrices a little bit. They're a product of risk assessments. They're tools to calculate risk associated with different attack narratives.
So I'm gonna get into the problem we're talking about. While threat matrices are very important for accurate modern assessments of risk, Their creation can oftentimes be kind of tedious, complicated, and prone to bias on part of the operators. This in turn results in poor risk assessment. We're hoping to solve these issues with our tool Enter the Matrix. Okay, so when I'm talking about risk assessments, I'm referring to NIST's special publication, A Guide to Conducting Risk Assessments. These assessments are meant to be executed regularly. They're supposed to be a major element of an organization's risk management process. One of the main products of these risk assessments are threat matrices.
So, yeah, when conducting risk assessments, you typically want to be concerned with your, you know, what threats are likely to happen, how do they manifest themselves, what's being attacked, Is it vulnerable and what are the potential impacts of that event occurring? Threat matrices organize all these concerns into attack narratives. These narratives quantify risk that an organization can utilize to better direct their resources with.
If you've never seen one, that there is a threat matrix. We're covering here what is being attacked in the threat scenario and event description columns. What it's vulnerable to and how is it being defended are kind of summed up in the vulnerabilities, predisposing conditions, and mitigation columns. Also, what the impact is in the level of impact column, obviously.
Okay, so why are these threat matrix things difficult? For one, it's really hard to maintain consistency between organizations and even within one organization. Calculating certain values in the matrix can be kind of complicated sometimes, especially if you're not doing this consistently all the time. This leads to bad assessments of risk and in turn wastes client resources. Lastly, just working within Excel in general is kind of a pain. present challenges and provide an opportunity for mistakes or bias on part of the operators. Okay. Me. That's me. Week one. Do a threat matrix. Yeah. Okay. Okay. So, here we've got an example. We'll say APT41 is executing some ransomware on your client organization. Threat matrices typically have multiple threat scenarios involved. Each of these scenarios are gonna have
a collection of events. Each of these events consider something being attacked, is it vulnerable, what are its defenses, and what are the impacts of it being attacked. Each event also has a threat source, which is highlighted here. As established group, we kind of call out a more specific APT41. Usually you'd want to think APTs or threat sources, insider threat sources here.
We also broke from the NIST guidelines a little bit to include MITRE ATT&CK IDs to the template. If you click on these, it'll take you to the MITRE ATT&CK framework website for full details on that. Also, threat source characteristics are there to model your attacker's capability, intent, and level of targeting. There's a column for relevance, which shows how that particular event is relevant to your to your client. For example, a confirmed event would be something that was successfully executed during the assessment. There's also two base likelihood values, one for the likelihood of that event being initiated and a likelihood for that event leading to adverse impact. These two are combined to yield a overall likelihood
value. We also have a chunk for vulnerabilities, predisposing conditions, Severities of vulnerabilities, the pervasiveness of predisposing conditions, and any mitigations that were observed during the assessment. Lastly, there's impact. This would consider the depth to which an organization would feel the effects of that particular event. Okay, so how is risk calculated there at the end? There are three major factors that go into that risk calculation. The first two are those base likelihood values that are again just kind of combined and yield an overall likelihood. Then the overall likelihood is combined with the level of impact, which then yields your overall risk associated with that event. You may be thinking like, well, what's the point of all those
other columns? It's important to take into account those other columns when deciding your likelihood values and your level of impact. Particularly your attack initiation likelihood really benefits from considering who your threat source is and that threat source's characteristics. Also when deciding, you know, how likely is that event to lead to adverse impacts, considering how relevant that event is to your client really helps there. When considering level of impact, taking into account those vulnerabilities, those conditions and mitigations in place that were seen during the assessment helps in choosing that value. It's important to point out that threat matrices are really meant to ensure that defenders, leadership, product owners, and assessors are all working from within the same reality and that
You know, the threat matrix is kind of a singular point of truth that if any modifications to it are to be made by either the client or the assessor, there needs to be very good reasoning in place before the change is made, not just because you might feel like risk should be different.
But this brings us to the tool we've been developing, Enter the Matrix, or ETM for short. It was created to make the entire threat matrix possible. process as painless as possible while increasing overall consistency within an assessing organization. It's also updatable as TTPs change over time. I don't know if anybody follows the ATT&CK framework or anything, but very frequently is updated. Over time, ETM has grown. It now includes graph generation, also improves consistency within the community, resulting in better data for hopefully, all of our clients. If you're interested in checking it out, you can go to the BlackLandern Security GitHub repo. It's free. It's a web application written in C Sharp on .NET Core. The data is all in Mongo.
It supports local authentication and can also do LDAP integration. It utilizes Graphiz and the D3 JavaScript library on the back end for generating graphs.
Okay, so, yeah, I'll just kind of go into how we are trying to accomplish solving those problems. Whenever you first load it up, this is gonna be the login screen you're presented with. So just to make the process less painful, a UI, instead of dealing directly with a spreadsheet, should reduce the pain felt.
Also, we've included helper dialogs. This contains information from the NIST special publication, as well as some descriptions that we painstakingly put together to make the values a little more human-readable and easy to understand. The threat matrix exports are done automatically, so there's no need to fuss with formatting and all that fun stuff. The calculations that I mentioned before for likelihood and overall risk are done automatically for you based on the inputs that you select. Also aims to improve consistency within organizations by providing a repository of past events done. This helps new employees and current employees just to kind of, you know, learn from the company's history. Also, there are templates, which allows the reuse of threat sources and different events.
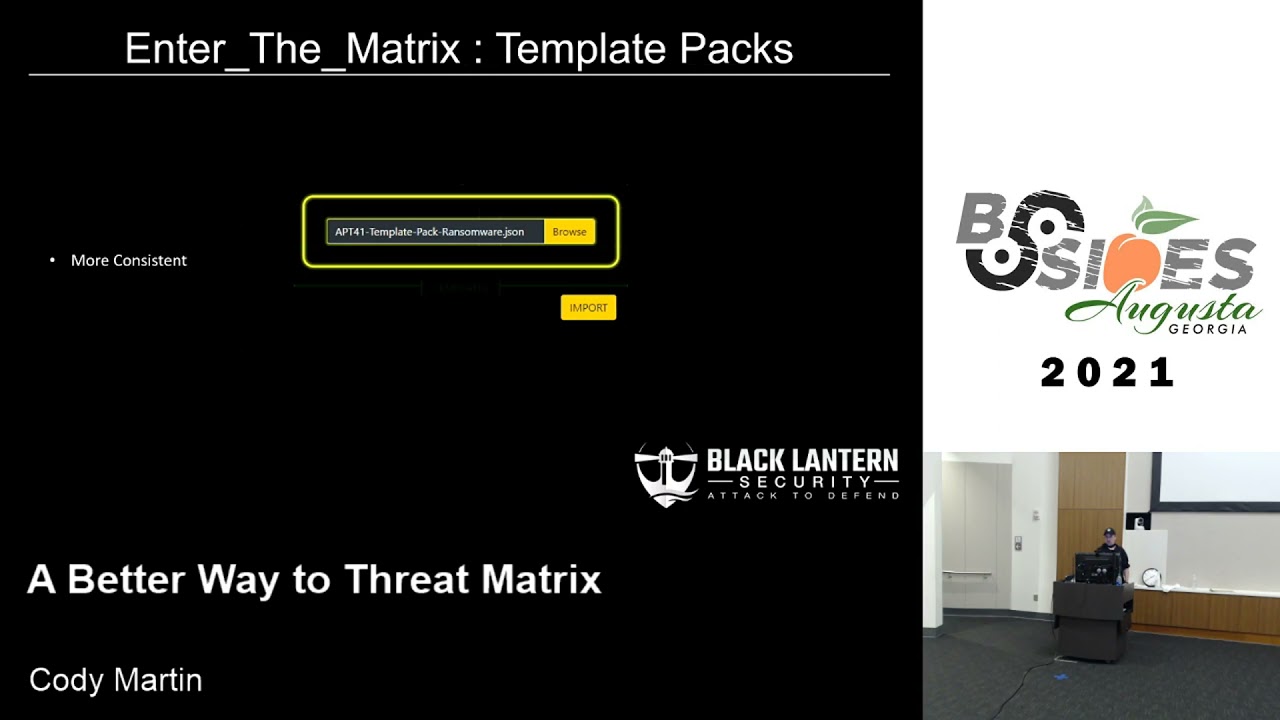
One of the goals with ETM is to improve consistency throughout the community, and we're hoping to do this by sharing template packs that can be imported and exported from the application. Also, ETM generates graphs to go alongside your attack narratives. These make presenting your results at the end of an assessment a little bit easier for the non-technical audiences.
ETM also, this is fairly new. but can generate attack trees. These accumulate all of the attack techniques used across an assessment and present them to the user. They're allowed to connect them however they want. These trees offer a wide range of customization that affect the size, shape, style, direction of growth. Also, each node within the graph has a range of features and options that change how they're presented within the graph.
The spreadsheets that are exported from here are actually living, so when you hand these over to your client and they work to improve their security posture over time, they can return and update these spreadsheets. When they do, those calculations that were being done automatically by ETM also exist within the spreadsheet, so their results will update as they update it. Lastly, ETM can export rep matrices to printable PDFs. just in case, for whatever reason, digital copies aren't preferred. But I'm gonna go into a demo. So that's enough, enough talking.
So, like I mentioned, oh, no, oh, no, no, no, fix that.
Come on, virtual machine. There we go.
Yeah, yeah, yeah. Yeah, okay. So, like I mentioned, you can, authenticate locally or integrate with LDAP. We're just going to do local here, and we'll actually go ahead and create a new user for us to use. Oh, no. No, no, no. Demo gods.
I'm showing the development experience here. Yeah, yeah,
yeah. Yeah, you're getting a great view here.
Okay, so. Okay, and then of course the display has to go back. Alrighty. I know, I know. We're gonna get through this. It's only a 30 minute talk. Uh-huh, uh-huh. Alright, so yeah. Like I said, we're gonna log in as admin user, go ahead and create ourselves an account to use.
Alright, so we already got a user, Matthew, we're going to create another user, call it Alice. Alice's password is going to be super secure, so it's going to be Alice.
Alright. Let's log in as Alice. Okay, so Like I said, there's a repository of past assessments that are done that you can go through. Inside of each assessment, you'll find a collection of scenarios that you can build out as your assessment goes on or if you want to wait until the end, however you want to do it. Here we can look at the APT41 ransomware scenario that I was talking about.
Kind of going from initial access with
Word documents, macros, up to pivoting through the environment. We are missing, actually, deploying ransomware, though. So we could go up here to create event. This would be where you would import from available templates. See, we don't have any here. That's okay. We can go over to templates. And we can import our template back for APT. using phishing to deploy ransomware.
Cool. And there's our templates. We can go back
to our scenario, go ahead and create an event. Now we have our available templates here. You could filter down ransomware import.
Most of these values are already prefilled. I'll just kind of show. We do support MITRE ATT&CK Enterprise Mobile and ATT&CK for ICS. They're kind of all in these accordion menus. You can filter that down, too, if you just want to find the impact-related guys, you know, that encrypted for impact there is ransomware. Yeah, moving down. I mentioned that there's helper dialogs included in all of these.
Say, capability, for instance, the reason we decided to do our own descriptions along with the NIST descriptions, because NIST uses descriptions like adversary has moderate resources and adversary has limited resources, and that's not super descriptive. So, make it a little bit easier. We gave not perfect, but better. It's not as vague.
And then for creating the tech narrative graphs, there's some graph info at the bottom here. These icons are all custom.
You can choose one or many different nodes that lead to the current one that you're working on. Let's see, for this particular one, it's only preceded by one. Compromising domain. And then we just save that guy. You can also, whenever you're in the middle of making a new event, you can go ahead and save that out as a template if you want.
We can export the graph. Like I was mentioning before, this is using the D3 JavaScript library on the back end. You can have fun if you're bored at work. You can just kind of click and drag it around.
But, yeah, click and drag wherever you want things to go. That's where they'll go. If you want to reset it, just kind of nice double click. These save as transparent, so if you've got watermarks or anything in your reports, you can totally use them with that. Okay, so let's go over threat trees. Going back to different scenarios in this assessment, clicking on threat tree. I kind of pre-prepared some of this. Normally, whenever you create a brand new threat tree, it's gonna ask you what categories do you wanna use. So you're not limited to just the MITRE frameworks categories, if you want to make categories like unicorns and sprinkles, you can do that if you want to. But
here I believe there's just five categories. And yeah, you can change a lot of aspects of these graphs, edge widths, do you want them ranked, clustered, do you want a directed graph? If you don't know what any of those mean, I don't blame you. There's picture examples just to kind of run you through what these sort of settings are going to do to your graph. and scroll to the bottom here to our edit event go ahead and enable it in the graph if I can click there we go we're gonna change its category down to impact
a lot of these things you can just leave default unless you really want to get crazy with the styling and which nodes actually lead to this particular technique getting executed. Let's see. It should be that guy and that guy. Okay. That's it. Just gonna go ahead and save it. And export. All right. And this is an example graph. Like I said, depending on your options for graph settings, it'll pop out. Here we're just showing how multiple paths of compromise can be linked together and the different possible outcomes that can be achieved with them. So let's see what else. What else, what else? Oh, okay.
So I also mentioned that these assessments, the threat matrix can be exported to like a printable PDF. basically just exporting to HTML. High contrast for people like me who have a hard time reading. This will show you all of the events associated with all of the scenarios in your assessment. Kind of makes a quick way to review things without having to click through the GUI. Printable. Obviously not the same colors, because that would be horrible on your ink bill. That's there.
And let's see, finally the actual threat matrix itself, the main purpose of doing these things.
I'm in Linux, so it's not gonna open in, you know, Excel, so it's gonna look a little different in OpenOffice.
I've noticed you don't have to do this for whatever reason in open office you kind of have to highlight everything just double click and it'll automatically expand this first scenario is just a test that's why everything kind of looks blank and empty but yeah all automatically formatted updating like I said these level of impact or the base likelihood values should have an effect here change this to 10 very high
also these links here would take you to the MITRE website. Maybe. It's going to open like four times now.
Oh, I'm not on the internet. Right, of course. Okay, but yeah, it would take you.
So that is pretty much everything I wanted to show off. Oh, no. Go to the end. There we go. Oh, oh, yeah. Yeah, so. Come on now.
Yay. Okay, so if anybody has any questions, I'm happy to answer them. Also, I have this network thing that I need to give away. But yeah, there's our GitHub page, BlackLandardSecurity. The tool, the ETM here is at Enter the Matrix. If you don't find me here and you have a question, you can go to my website or you can find me on Twitter.
of really big, annoying embedded Excel function. Yeah. Unfortunately, the calculations aren't like a normal math equation. It's more like a giant if-then-else statement. So yeah.
I still didn't catch it. Oh, oh, yeah. Yeah, we regularly update this as MITRE updates. I try to stay Google Alerts just for MITRE in general. So if they update something, usually within a few days, we'll update the different techniques that they have available.
Interesting. You asked about the graphs, particularly? Yeah, I think particularly about the graphs. Okay. The graphs that go alongside the attack narratives don't currently have a way of supporting disjoint graphs like that. The attack trees, yeah, you can have completely disjoint trees going up and down that way if you want to, or you can just have random nodes hanging out if you want.
to give a, as best as they can, definition for a threat matrix.
Related talks
 48:03
48:03 20:12
20:12 38:25
38:25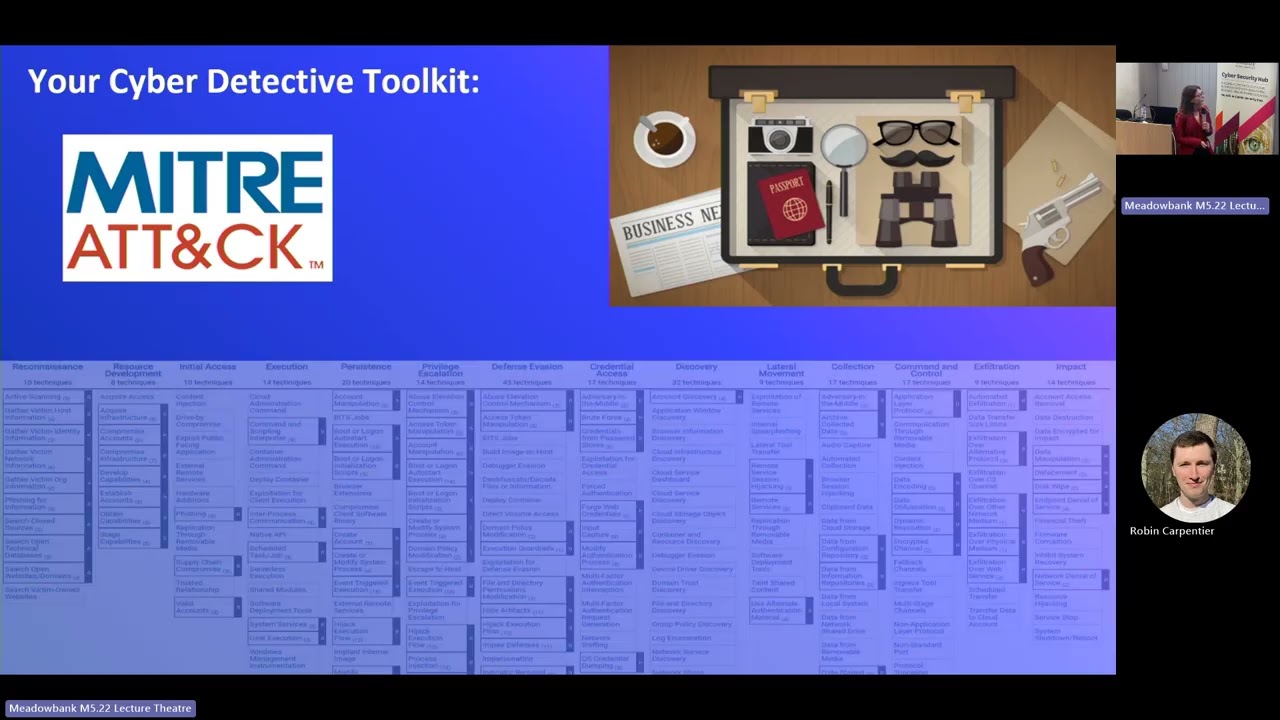 33:30
33:30 41:49
41:49 45:48
45:48