macOS Endpoint Security Framework: What It Can Do And How To Use It
Show original YouTube description
Show transcript [en]
thank you good morning back in 2019 apple at the worldwide developer conference announced they were making a dramatic change to the way they were dealing with the kernel space on their mac operating systems today i'm going to be dealing with one of the results of this namely the endpoint security framework or the esf i am a senior researcher with secure within their countercept team prior to being part of the research team was a threat hunter for years i have produced multiple white papers and proof of concept detection codes and presented at a number of international conventions so what are we going to be going over today we'll be going over what exactly the essay is
why the esf is important to the detection industry how can we in the industry utilize the esf some of the issues during implementation and some of the solutions that i found to these issues uh my device poc solution which i code named esfang and briefly going over a use case against the return pressure agent so first off what exactly is the esf so the esf is developed as a kernel-based telemetry acquisition system by apple and it's been developed as a way for a one-stop shop for telemetry needs from the security industry as you said it works in the kernel space and because of that it actually works fairly similar to the way the etw works inside the windows
operating system in many ways it succeeds the open bsm or the open basic security module by sun systems that was used primarily for auditing purposes prior to esf and one of the great results of esf is that it allows for real-time event acquisition for um direct intervention on a real-time interception but what does this exactly look like so the image on the right here gives a very basic overview of how this works from the user space at the bottom with a endpoint security application feeding into the kernel space and getting messages from the kernel space for the telemetry and on the left is a demonstration of that information which from every single event type includes multiple low-level
data points including the parent process id path environmental variables cd hashes and so forth but why is the esf important so during the presentation at the worldwide developer conference in 2019 they announced they were going to deprecate text or kernel extensions primarily this means that they were removing third-party current extensions from the kernel space meaning that third-party security vendors could not use their own kernel extensions for telemetry acquisition because of this they introduced something called system extensions which is their way of allowing kernel extension proprietary apple kernel extension access from the user space using something called system extensions equally before esf came along open bsm as i said was a primary auditing tool but it was quite clunky to use and
fairly difficult to integrate there's lots of documentation on the problems with open bsm so i won't go into them but needless to say earsafe is a much easier solution to getting these telemetry points so let's have a look at the old way of how monitoring worked so at the bottom we have the user space top kernel space on the left the logs so what would happen is is that third-party vendors would have their monitoring program hooked into a third-party canal extension running in the kernel space and acquire telemetry via that point then using open bsm hooks they would hook into log files and acquire them through an auditing process run them back to the monitoring program for
detection uh processing the new way is slightly different so as we said the system extensions work in the user space and they work on frameworks that were introduced by apple to directly access kernel space using their proprietary kernel extensions these work out as the network extension framework endpoint security framework esf and the driver kit framework and using a amalgamation of the three you have very high visibility over the low level telemetry of the operating system however we're focusing on the esf and from that it actually hooks into the endpoint security current extension getting developed by apple so it allows them to have this proprietary pipeline from the user space system extension to their maintained kernel extension
but why make the change so the one of the primary reasons that apple made the change to remove current extensions was for increased stability and security so by removing third-party kernel extensions you avoid things like the black screens of death but equally you avoid third-party malicious kind of accentuation being introduced into the operating system this means that they have much greater control over what is happening in the kernel space and it just eliminates a lot of the overheads and a lot of the problems that are being encountered with less stable current extensions that we're finding in the wild and it means that everything becomes very uniform one of the things to note about kernel extensions is that even though they've
been deprecated they can still be used they're just you have to dramatically reduce the security profile of a mac operating system in order to do so primarily you used to be able to introduce current extensions on the fly on demand however now you have to degrade the security profile that's running then you have to turn on canon extension and then reboot the system which means you can't just inject them as you would but how can we use the esf so this slides a little bit messy so i'll just walk you through it so in the bottom right you have the main code running in the user space of your program you would then create an endpoint
security client object this would then subscribe to the endpoint security kernel extension with the event types that you want so you specify the event points one like the file creation or process creation or anything to that sort of thing the endpoint security kernel extension then crea populates an event message queue in the kernel space and then pipes that out to your endpoint security client which you have already subscribed which you use to subscribe to the kernel extension then on on each message a callback is generated which you can have a callback monitor and then each message that's received can be processed back into your main code for detection purposes but what are some of the issues with the
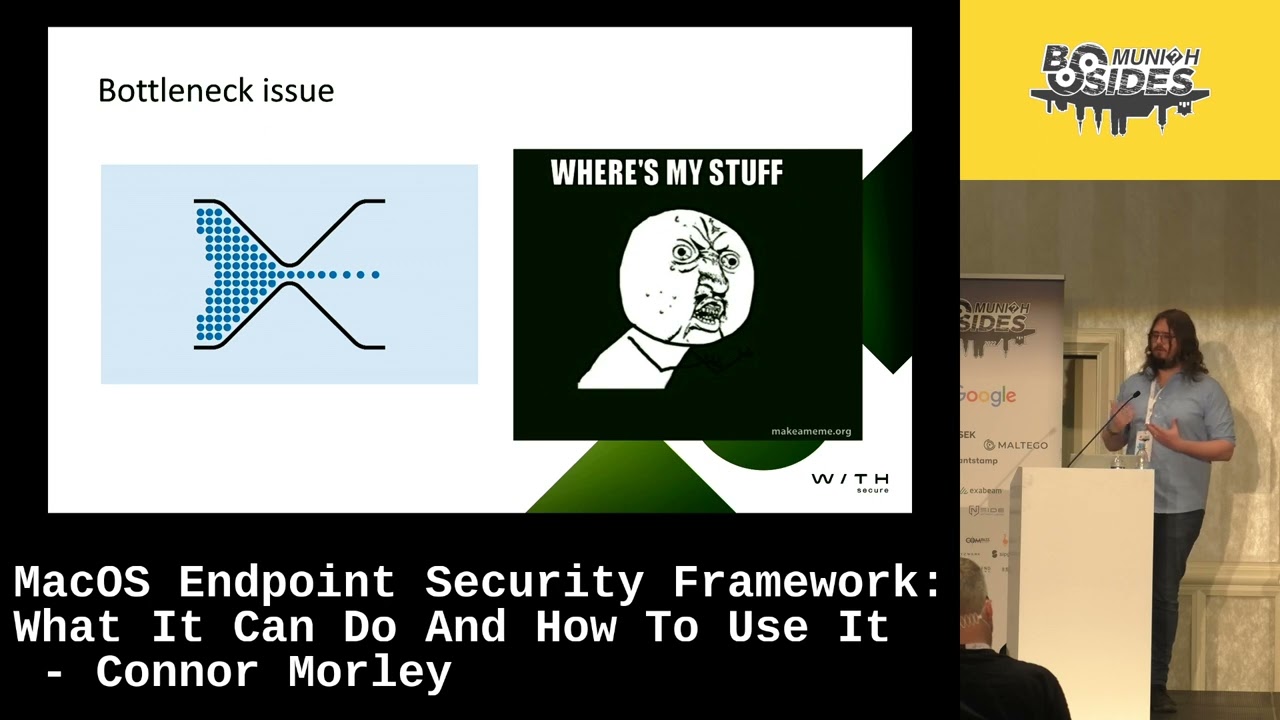
esf use and what are the solutions so during my experimentation with esf back in early 2020 there were a number of solutions that came out from multiple researchers and vendors but there were some very primary issues that came out with its utilization namely a bottlenecking issue uh system verbosity and real parent process id issue i shall go through each individually first of all a bottlenecking issue so this was actually something that i was banging my head against for a couple of weeks even a month two months and effectively what was happening was is where you were doing exactly the same experiment you would get different data points being populated and you'd have different numbers and it didn't really make any sense as
to why so you'd conduct the same malicious experiment using the esf telemetry acquisition but you'd always get you always get mismatched data points and you'd have data points that were being missing for no particular reason and equally from a detection perspective this means that it's inconsistent and therefore the data points are unreliable and it was a very long-standing reason before i figured out exactly why this was primarily the issue was caused by the kernel level q so you may remember from the previous slide i said that the kernel extension inside um for the esf would populate a queue within the kernel space but what was happening was is this queue was being overloaded because the
amount of data that you were subscribing to was simply too much so if you try to subscribe to too many event types the queue gets overloaded and silently drops data packets which then don't come back to the user space but there's no indication that this happens so although the packets have dropped from the kernel side because the kernel side is obviously secure and it's isolated you don't get a notification that this has happened which is which is problematic two primary solutions to this are a development solution and a esf proprietary solution i'll go over the event muting first so event event musing is a function that was built into esf and what it does is it allows for
specification for events to be dropped inside the current extension space now what this means is that through a process path or process token you can specify particular event types to be dropped on the kernel side and not published into the event message queue inside the kernel extension because of this it means that you can avoid overloading however it's quite a blunt tool back when i was experimenting with it because you either had to specify an entire process path again assuming it hasn't been hijacked by anything or you had to do it by process token which only works for that instance of the process it was either too much of a sledgehammer or it was too um unspecific it wasn't targeted
enough so for a um viable solution event muting just wasn't specific enough for effective filtering multi-client system however did turn out to be very effective so whereas you would have a endpoint security client within a process subscribe to event types instead of having one client subscribe to multiple event types you could have multiple clients subscribe to individual event types which equally generated their own queue within the kernel space and by using this method you don't get overload and you get all the data you require and you can conglomerate them into one data set and then run it through your detection stack by crop referencing which was very effective one point to note is that um the
original development was on sdk 10.15 for catalina this was when esf was introduced but between 10.15 and 10.15.4 the sdk was suddenly updated one with a number of new event types they increased something called the sec num or sequence number in the es message so whereas i was saying before there's no notification from the kernel that silent drops have occurred that is still the case but by using the sequence number you can see whether there's a gap in those sequence numbers to see whether a message has been dropped due to overloading so it doesn't alert you per se but it does allow you to filter that data and detect when it's happening and from that do diet things like dynamic
rebalancing in order to prevent overload system verbosity um if you look on the image on the right you'll see that the original uid is zero this is the system user id on the on the system on the operating system and because it works at the kernel level it ingests all the processing and all the file information for the system as well including system daemons and system level propriety management systems and this creates a problem because we've talked about the bottlenecking issue before the simple amount of data that's being processed by the esf when you take into account the system events is extremely high and because of this you end up with a sort of overhead issue where you have to
either filter out these system level events or you have to allow them but then do additional filtering for anomalous indications so one of the things again is that you could do it either before or after collection so before collection as we said would be by event muting but as i've said before this is quite a blunt tool and to use this for this sort of activity it means you'll be dropping the only way to do this would be to drop all processes running at the system level which can introduce ignorance of system level compromise which could be very dangerous so instead you have to look at client-side filtering but then you look at the bottleneck issue that i mentioned
before and even when you start to filter down the event types into individual clients you still run the risk of data events being dropped simply because the system level processing event generation is just so high so it's a becomes a balancing act between the two um there's no real one-size-fits-all solution for this so you have to sort of balance this dynamically as well as possible parent process id issue so this is an ongoing issue in the mac operating system primarily this relates back to identifying where the original process was spawned from so this actually goes back to things like xpc proxy launch d and more recently something called running board so you may see at the top there's a real
ppid of -1 this is actually by using a ppid solution um but as you can see because it was running on a newer open system the result has actually come out as -1 which is incorrect data just to demonstrate that this is actually an ongoing issue that there isn't really a permanent solution for at the bottom you can see that there is launch d being launched um xbc proxy being launched launched by launch d but that doesn't necessarily indicate where an original processor is called from the reason for this is because of how cross-process communications work in mac os it's not really that easy to identify what process was initiating another because it jumps through these other programs so
when you start to go back to the process chain that can be gapped due to these underlying system processes as i said there is no real future-proof solution the real reason for this is that apple keep changing the way that this cross-process communication works for process um spawning so any time a solution is made for one operating system version it can be made obsolete by the next update which as you can imagine is fairly frustrating the current solutions that i was looking at at the time were true tree by john bradley and launch xpc by patrick wall launch xvc was actually the solution that was implemented in my esfang solution but it doesn't take into account running
board at the time which means that as was demonstrated by the -1 real ppid it is not a fully fledged or conclusive solution to this as i said this is an ongoing problem that there isn't a one-size-fits-all solution for yet um and it it was beyond my scope to to try and figure that one out so looking at the solution that i developed on my psc poc which i code named es fang so first of all i need to shout out to patrick wardle chris ross and omar ikram they back in the early 2020 really set the stage for how esf could work the sort of telemetry acquisitions and really basic um fundamentals of how to ingest esf
data and the my poc was based primarily off of their work and then expanding on it and introducing capabilities and solutions that i mentioned before for some of the issues that i encountered my solution was actually developed early in 2021 um and it was based off of 52 event types back in sdk 10.15.4 the primary reason that i did this was that the old solutions had a fixed definition of what event types it would ingest and as i said before this meant that overloading could occur because it was a fixed number of event types which you couldn't necessarily um deviate from which if it was causing eventing you couldn't change from the rigid structure however the solution that i put in was a
dynamic solution so this allows you that each boot you can specify which event types you want to subscribe to so you can have multiple espang instances subscribe to different event types or you can have them subscribed to multi-event types or group types like file file creation data or file metadata uipc data um cross-beneath cross processed communication port data and things like that using this solution you can avoid the overhead um the bottlenecking issue i when i started this had never coded in objective c before so doing um multi-threaded processes to achieve this as a standard solution was actually a bit outside the scope but it is it should be easy to do moving forward from
any objective-c programmers out there one thing to note is that because this was not done with an apple developer id it is a poc code so sip has to be disabled or system integrity protection so esf cannot be accessed with sip enabled unless the program that you're using has been signed by an apple developer id so if you want to use this for testing purposes you have to disable sip on your system so this isn't viable for production level systems the other thing is that it was designed for json output for upstream integration so all the output is put into json format so it can be easily piped up into a database for further detection
processing and easy acquisition by um elastic or threatening teams to those data sets so let's go over the merterpretty use case use case was done on macos 11.2.2 i used esvang to collect all the data and this is for the agent only so this isn't to do with the metasploit frameworks capability that can be piped through the interpreter agent it is only for the native material agent capability this is only done on the post exploit phase so i'm not interested in how the agent got onto the system only what the age you can do once it is on a system and this was done only against a single host so not against an enterprise interconnected um sort of demonstration
so it's not necessarily representative of a real life attack but it's to demonstrate what esf telemetry is capable of so the overall findings again the graph on the right is very small it's it's a representation of all the um commands that were executed and the data that was generated as you can see from the top solution is actually uh webcam streaming which is not opsec obviously and as you can see it generates a massive amount of data but as you move further down you can see that some of the data some of the commands generated seemingly none of very little event types but i will go through some of these to demonstrate some of the data
values that can be found so during the install you can see that open read directory and protect were the highest event types that were generated through esf for temperature installation now memory protect and um memory mapping for new processes you expect this to occur and remember protect being that high is actually not bad anomalous even though it's quite a high number but if you turn this against what a normal process would do on the mac estate it actually doesn't stand out as that anomalous especially when you look into the internal data the open event however is slightly more anomalous alongside the fc ntl or file control events the reason for this is that during during deployment the amount
of file that it accesses in order to enumerate number of system um enumerate the system information and equally to change certain file access controls can be indicative of a temperature deployment so actually looking at these two specific event types does allow you to process a profile interpreter installation on a mac operating system
so breaking down that slide a little bit further in total 259 data points are generated during an interpreter installation but 259 data points doesn't necessarily mean that they're great data points quantity is not always an indicator of quality but if you have enough data points with enough cross referencing you can generate more accurate processes profiles and higher fidelity as long as you know what you're looking for and esf during my experimentation showed that it had both quantity and it had quality event types so by filtering the two together you actually get a very accurate representation of when anomalous behavior has occurred but let's look at some of the other event types that are generated and
against what sort of commands so on this slide again so this is to do with file open events so on the far right you can see webcam stream of 478 and it's not operation secure so that stands out like a sort of thumb process listing is slightly different so for each process that's running it opens an individual file for each process to see whether it is whether it is running um when you look at that event type individually you can actually filter out that it's scanning each individual processes file which is quite easy to profile if you already know what processes are running on the system you can just scan for is asus is a process scanning for all
the running processing files and detect against that the screen share and system information follows the uh same sort of um process so in order to enumerate and gather information about how it's going to screen share it has to open up a number of system files and system information it does the same way as it does for process listing instead of using general system information commands from the bash terminal and instead accesses a number of system um files on the on the operating system in order to enumerate that information notify right this is a really interesting one so edit file when it targets an individual file to edit it writes the information the file and you
get one writer then upload is slightly different so when you upload using meterpreter instead as it's transferring the data from your attack machine to the compromised machine each packet is appended to the file routinely as it's received which generates this nump this huge number of write events to an individual file but the write a size is quite small and it actually corresponds to the size of network packets being received from the interpreter agent so from this you can actually target one processor targeting one other file and write it then and doing it in very small increments um repeatedly especially if you filter out things like internet browsers and things like that you very quickly can
isolate when this is occurring io open is another interesting one so this is to do with driver or hardware access and again you'd expect to see webcam stream 220 because it's hijacking the webcam streams um data feed but screen share again because it's hijacking the user interface uh display feed it equally generates io event types and again io kit is not something you see commonly is quite a low generated event so finding any io kit events outside of system uid is quite anonymous and makes it very easy to identify when malicious behavior is occurring this is a list of some of the valued event types done against other that i've isolated from other investigations against things like
max shell swift sliver merlin and other attack frameworks one of the interesting ones uh one of the primary interesting ones is on the right there for pty grant uh the reason for this is that p3 guard is for pseudo-terminal generation so for a dynamic user session instead of piping the command through a bash terminal like you normally would instead max shell swift generates a pseudo terminal which is a master slave comparison and actually executes the commands that way which is slightly weird and you don't see that very often so in summary esf is extremely powerful and it's very clear that apple is taking the time to really look over the problems that are occurring during its use and equally to refine the
event types that are available during s d progression from sdk 10.15 to sdk 10.15.4 the number of event types increased but equally so did the capabilities of detection when the system wasn't necessarily doing what it was meant to because of this um it's actually quite especially quite reassuring knowing that apple have made this not really optional due to the deprecation of kernel extensions from third parties and the fact that they're actually maintaining this shows that they realize that they've taken that control away from the security industry but are actually taking steps to provide all the information and the stability that is required as we said some of the teething issues to begin with have been addressed but
there are still more that exist and during more and more experimentation they will rear their heads as we go forward as i said earlier um compared to prior solutions especially developing your internal extensions or using open bsn which is very clunky esf is very streamlined it's very easy to integrate into your existing stack and because of this it makes integration and development on it very easy from a security development standpoint looking at the use cases and some of the other experimentations that i've done in the past it does mean the detection capabilities that are available are very high and it means that moving forward we were able to create better detection profiles based off the esf telemetry
that is available in equally expanding event types that they're they're allowing the the final point to know is that as as i've mentioned the number of event points that are generated especially because the system level and even because of the low level temperatures available is very very high and because you don't have control over the current extension itself filtering is absolutely essential and it becomes not optional and it's one of those things that we're just going to have to deal with moving forward in when developing using the system that's my email that is the github with the esf rang source code if anyone has any questions please feel free to email me afterwards we do have some time for q a so if
anyone has your questions please
so if anybody has questions please come in frontier to the first mike just come to the mic yeah yeah yeah thanks
okay uh so uh thank you for the talk uh i was wondering from a perspective from a blue team uh what kind of events i'm kind of i'm um i can find when i'm look at the telemetry because uh i'm more familiar with the windows events and sometimes we can find like credentials passwords what's not good so we have to remove them do you know if there is something in place that remove this pi data or do i have to do it with myself so yeah that's great question so you'd have to do this all manually the events that are generated by the current extension themselves are raw so when you get them from the esf client side they
can't be tampered with from the current extension side so it will have to be filtered on the client slide itself um and there's no way of doing this further up the chain okay so if i decide to ingest this in some like uh splunk so i have to take care of this yes okay okay cool thank you very much no problem yep uh you mentioned that there's the user space component that is registering for for the filters or for events sorry yeah uh two questions basically is there also an unregister element that i can for example call if i'm doing a red teaming assessment and i got a gain access to this user space component can i then
call or unregister event that i basically disable monitoring for that uh so because the event monitoring has to be done together and it's done by an individual endpoint security client object inside the process there isn't a way to unregister them from an internal process unless you hijack it yourself and then basically destroy the object and recreate it you can't do it from external because it's an internal uh code object all right then the other question is also solved are there any other questions
yep we have time for another question nope okay thank you very much thanks for listening
Related talks
 31:19
31:19 28:03
28:03 49:41
49:41 55:25
55:25 50:58
50:58 26:05
26:05