Forecasting Cyber Attacks

Show original YouTube description
Show transcript [en]
so if you're in the right spot we're going to be talking about forecasting cyber attacks with mathematical models my name is charlene dever vasquez here's my corporate name i'll have my contact information on the last slide the reason i wanted to talk to you today is because in this past year i created this thing called a probabilistic risk modeling for cyber and that's one of the models out of this framework is what i'm going to be showing and talking to you about today i also recently wrote a book ensuring your business success with risk informed decisions the easy way to quantify risk what i tend to focus on is making it easy to do the work and to understand
what value it has for you and in your organization so i have a lot of information i want to try and share with you today in this session specifically what i want to kind of go over is using minor attack model to build up a framework of a scenario that you want to model the probability of this attack occurring in your organization the goal of this whole activity the reason why we would try and quantify risk in this way the reason that we would try and model cyber attacks is to give your organization time to come up with mitigations and strategies to avoid that attack occurring in your organization at the end of this i also have something very that i'm very
excited about a new kind of model that i want to share with you the math of which was only theorized last year so the first section of this is going to be something very applicable and if you stay around to the last slide you'll have a link where you can actually download the attack model that i'm talking about in this speech you can actually take that take all the techniques and the strategies i give you with this take it back and you can actually play with it and use it yourself so i'm going to give you that but then at the very end i want to show you this new model so first let's talk about methods so
when i'm talking about mathematical models i'm talking about using the math of probability and so this first part i'm going to describe the methods of probability don't worry there's no math in here well i lie there's one equation and it's very simple so what we're going to be doing with these models is forecasting risk so we're trying to look ahead of time at what the probability what is one potential event outcome in the future that might happen we want to try and forecast that so that we can develop mitigations and prepare ourselves so that we can avoid that outcome does that make sense so when we talk about forecasting it's kind of like the weather we were just talking
when we got prepared to come down this weekend there was no rain in the forecast today it's going to rain right so the forecast changes as events occur and as we have more information so when we start to do a forecast we really don't have to have a lot of information we don't have to have almost any information at all in fact if i don't have any information i can create a forecast that is very accurate i do that because i have a broader range of risk that i'm forecasting as i have more information i become precise and my range becomes smaller does that make sense let me say that again i don't have to have a lot of
information i can be accurate on an initial assessment because the range is broad as i have more information i'm going to become more precise and my range will become more narrow okay if you can grasp this one key concept you will be several steps ahead of a lot of organizations who struggle with trying to forecast because they think they have to have a lot of information you don't you don't have to have a lot of information the math is what will get you from i know nothing to i know something i know more and now i know a lot more all right so we're going to start talking about these methods and you're going to want to become comfortable in
relying on the underlying math so when we talk about this range they're really usually three key values you want to think of what's my worst case my best case and my most likely what can the models actually tell us they're not really a crystal ball they're only going to give out based on what you put in to the models but what they can tell you dependably what the math can tell you is the probability of an event very solid the number of events that will occur again very solid this math is very old it's very dependable what is the outcome of two probabilities in that case think of a threat actor in your security defense posture right what's the outcome
of these two probabilities these are the three basic things that all probability models can give you with these you can do a great deal of forecasting so as we start talking about the language in these models i'm going to give you some terminology and i know these words might be used differently in other places but for our purposes today a threat is another way of saying i have a weakness or a vulnerability that's a threat the likelihood is the likelihood that the threat actor having access would be able to leverage that threat against me so we're going to be talking about a threat and a likelihood these are the two key values we're going to look at
and as you start thinking long term why am i doing this i want to build up mitigations i want to avoid this potential outcome if you can eliminate either the threat or the likelihood the risk no longer exists you have to have both so some of the probabilistic methods and there are three here that i'll highlight these are the three main and i'll go over each of these almost all of your probabilistic models are going to use one of these at a time or you might have an opportunity to use both of these depending on how you're coming at the threat so let's start with a bayesian joint probability a joint probability is where i have two
data sets and they overlap i could just call this a joint probability and and be done with that but i put the word bayesian in front of this and i want to give you a little background so the math of bayesian theory was mathematician who wanted to model how we actually learn mathematically how could i express the learning process and so the learning process mathematically is a lot like the scientific process i have an initial belief i do some analysis and then i have a posterior belief which becomes my new beginning belief and the cycle repeats so when we say a bayesian joint probability what we're really saying is this is an iterative process and you
will repeat this every time you have new information or something has changed or you want to look at it again so these kinds of mathematical models are not a one and done like a compliance assessment they should be an ongoing thing that you're doing in your organization continually so the bayesian joint probability we're going to get into more and this is going to be the one that you're going to use with the model that i'm going to give you this joint probability the second one is called a monte carlo simulation now the math for monte carlo let's see so bayesian was in the 17 1800s monte carlo was in the 1930s so they were trying to mathematically understand the
dispersion of neutrons think nuclear reaction so there's a lot of uncertainty in that and so this math this mathematical model is what they use to gain more assurance and understanding about this very uncertain process and the way that it works you have to have a model to do this you can't just do this in your head you have to have a model and what it does is you give it your worst case your best case you give it a range a bottom and an upper range and within that range it will generate thousands of probabilities like random numbers within that range it'll never go above never go below so in the framework that i use we generate a
thousand probabilities these executed the push of a button so within that range the math behind this takes the thousand probabilities generates them and then it correlates cross-references them and then it charts them out of all of these which ones occurred most frequently the chart of that is the third thing here which is the probability distribution that's the output of the monte carlo and that gives you think of it in a bar stack chart how all of these probabilities occurred which ones occurred most frequently so now you have actually generated something that graphically represents to you the probability of what was previously unknown that's pretty cool so this is a joint probability an easy way to think of this is the venn
diagram and i think somebody else had this beautiful math on their slide so this is the the bayesian formula there are actually several that you can use to express exactly the same thing when we read the equation it says the probability of the joint union between a and b is equal to the probability of a given what we know about b times the probability of b let's simplify that so instead we're going to use this equation times likelihood equals risk that's it so if you can get your your mind around this very simple equation using the terminology that i gave you threat as a weakness likelihood is the likelihood that a threat actor is going to leverage
that against me and use this one equation you'll be able to quantify the risk of any cyber attack and i'll show you how we do this so think of this as we said a venn diagram where a and b overlap that middle section is the risk anything that is outside that to the left or the right is not a risk it might be a threat it might be a likelihood but it is not the risk it's usually at this point where people start thinking okay i've got a basic equation i understand some of the methodology under the hood how am i going to come up with an estimate i how do i how do i know what the numbers
should be for the estimate well i'm going to give you a really easy way to do that almost everybody uses qualitative analytics so everybody's kind of familiar with this one through five scale of risk very low through very high if you just take that one through five scale and you convert those to 20 ranges you have ranges so now when you're having a conversation with leadership or with operation staff and you say well what do you think our our threat is in this area what do you think you know the percentages of our systems are that have these kinds of vulnerabilities they may say something like well we think that's a very low risk great
does 0 to 20 sound about right for you and this is how you can begin to have these conversations moving from a qualitative set of language to quantifying it now again we said these are going to be initial estimates and our ranges can be quite broad we narrow them as we go in so one thing i also want to add is we're talking about initial estimates a lot of people will think well if i'm going to do this i have to have a lot of data has to be very detailed there's tremendous value in having an initial estimate and let me explain why if you're working with leadership they're going to ask you a question off
the cuff while i saw this attack what's the likelihood that could happen to us so what i'm going to show you here is a way that you can answer them and fairly quickly the value of that initial estimate does two things the whole reason we do this for leadership is to help them make decisions this is a decision support process in the first case they can say well that aligns well with what i think and what we expected thank you or they can say well that's not quite what i thought it might be can you go get some more detail and refine this now you have leadership buy-in we all know how important that is and now you
can go get all the data that you need to refine your estimate does this make sense so never be afraid of an initial estimates tremendous value so now you have a way to begin getting your ranges so let's do one of these calculations we're going to do more of these as we go along you can calculate this in your header if you're like me pull out your smartphone so let's say that we're talking about a likelihood of 80 so in other words the likelihood that a threat actor let's say a cyber criminal having access to the threat my weakness what's the likelihood that they would succeed in leveraging that against me let's say that i've got a pretty mature
security practice in my organization and i think that my my weakness my my threat level is really pretty low so we'll say that's a 20 we're really pretty good so what's the risk well if i just convert the percentages to decimal 0.8 times 0.2 is 0.16 your risk value is point 16. that's not complicated that's pretty simple so if you were asked this question from leadership or a stakeholder you could very quickly give them an initial estimate that's very accurate because it's fairly broad makes sense so remember what we said about the five ranges you notice that i took the top value of each of these five ranges in my calculation and that's just kind of a
rule of thumb of how you would proceed so let's keep going so we said that the monte carlo creates a thousand simulations you can do less than that if you generated a hundred uh probabilities at a time you would already know what the shape of that probability looks like but if you generate a thousand and you have much more detail much more rich and in depth right but you can do any number of those we do a thousand so this is another snippet of what one of these looks like in this case my minimum is 25 my maximum is 50 so it was a little more than 20 range here but my most likely was 45 so if you look at how the chart
is skewed you can see that the most likely value that you pick in your ranges skews the probability of the chart so when you have these three values it doesn't always have to be in the middle it can be skewed to the left skewed to the right for whatever reasons but you want to start thinking about always doing this as the minimum most likely and the and the maximum value so in the in the example we used before generally when somebody asks you and you give a value back like that you're talking about the most likely but if you want to represent the full range you would do three calculations one for each of those values and in this
way you can use the probability joint um the um the what do you hate that when your brain just skips a beat but you can use that to approximate the the monte carlo so those are the methods and now that we've talked a little bit about what's under the hood let's go talk about the miter attack model so i'm guessing most people here have heard of miter attack model and you've used this framework yes show of hands yeah that's why i thought um i put this first slide up there you might not know but a few days ago there was an update to the mitre attack framework so i just kind of put that up there
for awareness so those of you who haven't used this and just to explain to you how i use this in the model the miter attack is this community driven de facto standard of all this information related to attack so i'm going to use this as a resource to go do my research from and the areas i'm going to go look first i'm going to go take a look at tactics the tactics align with the life cycle of the attack sequence and in my model i'm going to lay out everything that i'm analyzing by the attack sequence from beginning to end so i'll probably go look at tactics and decides which of these i want to include in my model
and then i'm going to go look at some of the techniques and i'll give you two scenarios that i built together in this and i lay out for you so i'm going to go look at techniques i'm going to get some information from that given the models that i want to do today i'm also going to take a look at some very specific groups to kind of see the kinds of things that these groups typically do i'm also going to go look at software one of the models i'm going to do for you is a very specific piece of software so i'm going to go look at that and see okay who else uses this software so i'm
going to go do all this research and kind of pull together the kinds of things that i want to include in my model so that i can answer the question that leadership has asked what's the likelihood that that will happen to us so the first one we'll take a look at is emoteet so on this chart i kind of lay out my process so i'm going to go to mitre and i'm going to look at the groups who've used this i'm trying to see what kind of behavior how did they use this what did they do with it what were the what are the things that they were able to accomplish i'm going to go look at the
software itself i'm going to go look at the tactics that's going to be my life cycle and then i'll go look at some of the techniques and i'll pick and choose the ones that i want to put into my scenario does this make sense as i'm doing this research i'm also going to deconstruct the attack so i can understand what was the sequence that people used i'm also trying to identify what are the vulnerabilities that they leveraged in the attack because i'm going to turn around and look at my own data and say do i have any of these vulnerabilities or vulnerabilities like this in my environment right and then i'm also from this gonna pull
out what are some of the best practices because the whole reason we do this is to give ourselves time to plan a way to mitigate and prevent this from happening to us so i'm gonna i'm gonna look at best practices and then i'm gonna start developing what are mitigations what are some things that we can do to stop the cycle or to prevent it all together so i'm also going to take a look at the news and anything else that i can find about this group this came from cso online the the threat group initially ta-542 from 2014 to 2019 emittet was their signature payload they ran email campaigns primarily against banks for fraud think trojan
right they used to deliver it's also used to deliver trick bot which has been identified as a precursor to ransomware so keep that in your mind some things that you see happen are a precursor to something else so if you want to predict the likelihood of that end game look for some of the precursor events there was a multinational collaboration and the initial group was shut down in 2021 but then in april just this year this kind of activity was seen again and so this is this goes back to that cso online the link that i have at the bottom they talk about that in this article but now they're doing different things with this they have new tactics
that they're using so they use lower volume of email instead of high volume they've brought the volume down they use one drive and they've transitioned from macros to dlls there's some different things they're doing here and some people are saying that this is in response to a microsoft announcement that was put out but again you're collecting research to build your scenario also in this article from proofpoint they have this really interesting chart and i want you to pay attention to this chart so when emoted first started um being used so this is from 1917 to 2017 2019 i want you to take a look at the pattern it starts off very low and then there's more i'll call that
excitement and then there are gaps in between and then there's a lot of excitement it comes back down it's very irregular we don't see behavior like this that is constant either flat or always on a single curved arc you have these jumps and breaks in between so when we get to the model at the end of this i want you to realize this is normal behavior that we actually see because this is the kind of thing that that model predicts so there's some more news related to this particular first scenario that i want to put together and this one came from syste.gov so another group wizard spider had been known to use trickbot and then
they would put ransomware out and they would use this against a wide range of organizations so in my scenario i can look at this and say maybe my scenario is targeted against some of these organizations corporations governments or hospitals right so that gives me my targets i might use and there was also a recent announcement that cyber crime groups are pledging support to russia and they have threatened to conduct cyber operations in retaliations for those offenses against russia think america right so my scenario at the bottom of the screen here is an emote phishing attack with a malicious download link leading to an installation of trickbot and a ransomware or a wiper and and now i'm going to show you the
second scenario and why i have oral wiper in there right as i build out these scenarios you'll notice that i'm not digging deep deep deep into very specific techniques that they're using i'm generalizing and i'm generalizing because if you were listening yesterday to many of the speakers and today as well many of them repeat the same thing these people will very quickly pivot from one payload to another payload from one target to another target so if you if you raise your analysis up a level and you look at the types of attacks and the type of techniques then you will accomplish your goal which is what's the likelihood for my organization and what can i do to
protect myself against this not just one technique but these kinds of attacks make sense so as i start pulling my data together for this one i'm going to look at the weaknesses in my own organization i'm going to look at things like how are my my systems hardened do i have weak protocols in use what does my remote access look like what am i using i should be monitoring for indicators of compromise i'm going to look at my processes do i have an incident response process for a vulnerability to download malware is that in my playbook do i really have that maybe i need to go dust that off take a look at it i'm also going to look
at the people aspect of the process do i have people who are working at home and are they more vulnerable maybe for phishing related emails that might say hey corporate has an update security patch coming your way right think about these things as i put this scenario together right so now let's talk about how i would start modeling attack number two and then i'll take you to the analysis side so for attack number two i want to pick a group this time first one was software this time it's a group apt-29 and i'm going to pull out a wiper scenario because this was in the news recently so again this slide is like it was in my
attack version number one i'm going to look at groups software i'm going to miter attack doing my research i'm going to look at some of the tactics and techniques then i'm going to take a look at the what was just in the news and i'll show you that in a second i'm going to start deconstructing that attack what did they do what was the sequence what vulnerabilities did they leverage what best practices can i pull out from this let me go look at my own vulnerabilities what do i have that relates to this and then how can i start developing mitigations what can we start to do to plan to avoid this if possible so for apt-29
there is some history here they've been identified as associated with solar winds that was a software update not petcha which was a precursor to solarwinds remember how we mentioned that you can have precursors there's one but that wasn't actually ransomware it was fake and it was a wiper right log4j that was an open source library attack that's slightly different indications of collaborations and attacks against u.s banks those were seen since the sanctions were levied against russia remember how in the previous tax scenario i made a note of the fact that oh yeah some of the some of the people said you know we're going to stand with russia you know in retaliation they've done that before you can expect they'll do it
again and there were there were attacks on the ukraine electric grid think iot and there were healthcare wipers that were used so i've kind of got this this group of of potentials to put into my scenario so as i'm doing my research hhhs.gov put out this wonderful detailed piece of um uh information on on all tactic techniques it's great see if you haven't taken a look at it go take a look at it but what they highlighted that i picked out just one of them was a hermetic wiper so this is recent and it occurred after a denial of service that they did a denial of service first it came with an executable and it leveraged
a legitimate happen to be chinese tool with a digital signature which has now been revoked well that's kind of interesting what was interesting is that they knew what was in the environment and that was what they targeted so that might make me think oh well what are some of the known things i have in my environment maybe i should focus on those it had multiple variants remember they're gonna retool and pivot very quickly one of the things that it did it compromised tomcat and it executed a powershell and then it downloaded a jpeg which i thought was really intriguing i wonder where they're going to go with that in another case they used smb week
protocol against exchange right so we see that right we had that in the first one so the scenario i might put together for this one is to consider a denial of service as a red flag then it's going to be followed up with an update or a warning email that's sent out it's going to have a link to a download executable hey we've got you know something happening in the environment we want you to update right and then that executable would install something to compromise and then the wiper would follow after that now as we put this together just as research to develop a scenario what's also kind of curious is that the fbi in
the last i think it was at least the last two months maybe six weeks they had a forward-facing website that was compromised it was put under a denial of service but nothing else happened but they the attackers sent out an email and said oh hey this has happened and people who got that believed it and they fell into their incident response programs so the attack was very much like this and it caused people to take an action and i thought that was very interesting it wasn't they were just going after this website they wanted to see what you were going to do and i thought that was very telling so you collect this information and then
you start looking at your own data so in this case i'm going to look at web facing applications i'm going to look at compromises you know for dos denial of service i'm going to look at you know what's my weaknesses in the areas of lateral movement malicious payload you know i'm going to take a real good look at that again i'm going to question my processes and i'm going to question my people and take a look at all these areas now let's see how we're gonna quantify this so we're gonna have this screen up here we're gonna go through this for a couple of minutes because this is the analysis so everything else was what's the scenario i want to play out
what data do i want to go take a look at and then now how do i do the analysis so the first thing i'm looking at is for my tax sequence on initial access in other words who clicked who got the email and clicked that's my remember we said that's my initial access so i know that the industry best practice the best that you could expect your organization organization to get if you're actively training on you know people not clicking on the link for phishing is about five percent so maybe my organized organization is really not quite that good but they're not bad so maybe 12 maybe i've got some statistics in house maybe i've done this kind of training so
maybe i have some data that i can use that percent to pull in on the second line i'm looking at execution so on this count maybe i don't have a lot of data available but remember we said we can create ranges and we can do that math very easily so if i talk to operations they go well that's very low we're very good that's a very low and i'm going to consider my likelihood if a threat actor gained access the likelihood that they would leverage it against me is high so i'm going to stay on 80 for all of these right so i've also defined kind of by that who my threat actor is and and how capable they
are right so and then if we take this from the example before point eight times point two is point sixteen so i have a 16 percent risk in this area does this make sense so far are you following along with me yes i see heads not excellent so now let's look at the next one which is persistent what is the likelihood what are the vulnerabilities i have that once they're on one system they can move laterally and or become persistent on that system so maybe in this case i think that my security here my systems and configuration is not very good maybe it's medium right maybe it's medium maybe i don't have all my systems locked down exactly
the same i've got some that have some variations some some differences right which kind of describes most organizations right so in that case i'm going to use a 0.60 for that range and i'm going to use my 0.80 and i'm going to come up with a 48 risk in this area and i continue doing this same process all the way down and so my attack sequence i got that from the tactics of mitre and i picked and choose which ones of those i wanted to to do which is nearly all of them but this is the process that you follow so for each of these i could easily say talking to operations without having to do a massive data pull
without having to do a heavy stop and go pull data just a quick conversation build up those relationships you know what do you think it's like or if you have assessments in your organization that's another great resource to go pull the assessments that have been done they'll identify all these kinds of weaknesses if you're looking at the weaknesses within your vulnerability data having some way to interpret and dig into that data is very helpful one of the things i like to do and something that's in the prmod framework is a spreadsheet that allows you to drop your vulnerability data in and it will rapidly pull out by texturing things like admin privileges access weaknesses protocol weaknesses so
i can quickly tag my data and generate for myself some sort of percentage that i can use in my calculations and once you have that it doesn't take very long to you know to wash and repeat that process so is this part making sense do we i'm going to want to stop here for just a few minutes does anybody have questions on this part of it how we got to this how we built up the scenarios how we looked at our data because that's the heavy lift before the actual assessment the math is easy right and that's easy but it's this other work before that so do we have any questions here before i go on
i'm sorry you're gonna have to speak up for
yeah me called probabilistic risk modeling for cyber so in our industry cyber there are really basically two frameworks pr mod for cyber and fair i don't know if you've heard of fair fair uses never heard it okay fair is an international
and online website you can get all the information on that awesome austin yes you're welcome so the story of prmod the story behind both of them uh fair was created by jack jones he was a ciso at the time and his board said you know he wanted to make a purchase i don't remember what the equipment was but he wanted to purchase some equipment and he took it to the board and he said we need this and the board said that's great but if i if you spend this money how much is that going to reduce your risk and you couldn't answer the question who could so he went out and created quantification for risk cyber risk which
was the precursor to the standard fare and it uses the monte carlo simulation method remember i told you i have two three methods so that's the method that it uses that's how the story behind it where how it was created and it looks at a financial impact because that was what he needed right he needed to justify the board so this came from work that i have done with clients because um we needed to i needed to answer many other questions that were not related to finance i needed to answer questions about the probability of being attacked from my perimeter strength analyzing my system level strength supply chain risk process risk cyber attack risk all of these other questions long before
you get to the question of what would that cost right so there were not a lot of tools out there you could either program it in a different language which i didn't want to do you could use the scientific tool which i didn't want to do because it's not written in the language of cyber and that would be complicated to me so i thought the easier thing would be just go build it which is what i did and it's an excel spreadsheet that runs on your laptop because in the last five years the libraries in excel can now do the math and there's are there are tools that now allow you to actually build these kinds of probabilistic models on
the platform so prior to three or four years ago you couldn't even have built this and it wouldn't have run on your laptop you would have had to have done it some other way and so that's why there are not a lot of these kinds of models out there so before we leave this any other questions no okay so the last comment i'll make on this when you're doing this kind of work um you can use historical data to build up percentages right um you can use the one through five qualitative the quantitative scale to start giving you a range right you can use the joint probability understanding that you're giving one value out of that range which is usually
your most likely right and then as i said at the very bottom i encourage you to generalize to look for types of attacks so that your analysis has a broader applicability to the organization okay so if there are no other questions on that let me show you what the charting of this looks like at the end so because this is in excel i can just take those two columns of numbers pull them into another spreadsheet and i can generate any kind of charts i want bar charts so now i have something i can take to leadership so they can understand and say this is the risk that our organization has from these kinds of attacks
that we can look long-term to how we now might generate mitigation plans to avoid this and you'll have recommendations in every area what can i do for initial access what can i do about execution what can i do about lateral movement you'll have now recommendations best practices and strategies across the entire landscape of the attack so now yes
correct so so this is an ex yeah so it's an excel generated thing so what i did is i took my probability column i took those numbers and i took this column which has my categories that's all i did and i let excel auto-generate
they're looked at independently we calculated the probability of these independently now in the framework i do give you what i call a helper so that if you wanted to weight these then you would have something that is related more to what you're speaking about so that if if this likelihood is very low then that should change the scale for all of the others but i didn't put it in this example yes yes but the other thing i would just say is you know if you had something as small as five percent in many cases all it takes is one click that really could be a barn door it looks like a small barn door but it's
still a barn door okay so now let's let's talk about some some long range forecasts this is the new model that i was very excited to bring to you so when i was looking at putting this together log4j was something that had just hit the news and then just like in the last couple of days there was this new bit of news that came out about a different kind of library this npr mp npm package and that it was now not just being downloaded as people downloaded it but it was being made a dependency and being pushed so like log 4j is the same kind of attack but the technique is very different why because they want it to
get out there rapidly right so if i were looking at this kind of attack and just saying well what's the what if long range how could i predict that so this is what this model does in 1970 there was some fairly new math that came out and this was called a hawks process what the hawks process says is one event increases the likelihood of another event there have been white papers published um on on on these hawks itself that process has now been widely adopted in epidemiology seismology finance a number of places because it begins to give us this way to map and to predict events occurring as we saw in that chart that they're not just a mathematical
model that has a rate and a speed and it kind of gives you you know it's accurate but but that's not really how events occur they occur in these clumps and there's you know delays in between and they're very different hawks laid the foundation for that concept in 1970. in 2021 andrew dawe theorized another kind of counting process that now lets you not only say yes one event increases the likelihood of another eve event but how long does that effect remain in duration and if you can mathematically calculate this you can get very close to predicting when the event will occur that's very new we've not been able to do that before this is very exciting so
dawes math was theorized and published last year there at least two there are a couple of papers but there are at least two that have used this math one was for department of defense and they said if somebody had an ied what's the time period that others might be emboldened to do this again so you can see the the real life impact of what this would do another paper looked at teenage suicides these occur in clumps so if i have one suicide am i at the beginning of a clump what do i think that scale might look like can i do anything how would i now react to this community right so what we did in in 2022 just
this last quarter we took the math and we implemented it in a model and i want to show you what it looks like so as i looked at applying this new math i wanted to look at cyber attacks because that's what i do what the model is modeling is the underlying human behavior that is impacted and i also wanted to look at risk so if i'm looking at what's happening in the news today and i see these things happening across the world what's that risk to me what's the risk to my organization because i'm trying to protect my organizations and i said i want to look at the indicators of prevalence and so i want to ask a few
questions is it being actively exploited is it in my geographic area yes no is it on my platform yes no is it in my industry yes no do i have a third party that's impacted you can see each of these questions begins to give you a feel for who the threat actor might be and what their motivation might be as well as the path of it coming to me and the idea is that if i can forecast this far enough out i can start to develop mitigations and in the framework if it is below 40 you're monitoring it and beginning to develop mitigations once it's over 60 implement does that make sense trying to give you a gateway to look at something
long term update in real time to prepare so this is what the input looks like and in this i'm going to compare two sets 2 000 events and 8 000 events in a 10-day time period um so the one we have in front is the 8000 and you'll see the indicators of prevalence right now it's being actively exploited it's not in my industry it's not my geographic right everything else is no so that's the input and this is what the output looks like this name g7 and nth gsep these are the two counting processes that daw created that never existed before before we had counting processes so when we say counting processes think time cueing
processes think uh real time delivery in supply chain how do i know what do i need to calculate because i'm doing this kind of math of queuing i know what comes in i know what goes out and i know what that looks like so we have things like poisson's exponentials and gamma probability distributions right we talked about the monte carlo and the output of that so those are counting processes these are counting processes that show that self-excitement when one event occurs another one occurs that increases the likelihood it increases the likelihood again so the chart we're going to see the growth pattern at the end that i'll show you is substantially different the chart on the left top is normal
probability distribution any probability matrix can give you this the one on the left is the cumulative and any of them can give you that what sits in the middle is the probability of a jump that self excitement when is it going to occur and how big is it going to occur and it's charted over time in this case it's charted over 100 time period whatever your whatever your time period is you're looking at could be hours days weeks so when we i did this initial example i said over 10 days so i've got it the 10 days to spread out over 100 time periods does that make sense the chart on the bottom is the same
probability just in a different chart so you can see how it looks over time now what if i want to compare these two because different counting processes behave in different ways a poisson is a standard rate but nothing occurs evenly all the time like that not in human behavior and other behavior right a um an exponential is a growth pattern a gamma tells you when the first event will occur so all these underlying counting process behave differently so if i want to generate the self-excitement based on these counting processes i also want to compare what they look like compared to each other this shows you in the first snapshot of 2000 events in 10 days what that looked like
you see how small that is in the bottom corner of that chart so to normalize the the access and then compare the self excitement when you have 8 000 the next day occurring you can see that it doesn't just quadruple it is substantially more each event increases the likelihood of more events so the way you would use a model like this is when it begins you would start charting then and you would continue to chart it this way over time and then you would also be able to understand what the risk is relative to you and what those events might look like when they might occur in that time pattern does that make sense so
the two models i've shown you here the first is the pr mod for cyber framework and the second one is the mark talks process with indicators of prevalence for cyber both of those are mine in the probabilistic risk modeling framework it's a spreadsheet with multiple models in them it includes everything that fair has you could do a full affair process in this if you wanted it gives you the methods independently so i could use the methods combine them however i wanted to do it in my analysis and it also gives you models that are pre-formed like supply chain compliance and industry attack which we look like tabletop exercises and and other things processes i'll give
you here's a good one if you want to find a way to rapidly reduce your risk take a real good look at your processes if you have processes that are inconsistently applied you have risk if you can make them consistently applied you might be able to move that risk from high to very low that's almost forty to sixty percent reduction of risk nobody thinks to look at your processes take a look at them so here is um the link that i'll give you and if you uh we'll distribute the slide deck but if you if you don't have that or for whatever reason you can also just reach out to me but on the link you'll be able
to download a copy of the model that we worked with today for free for the attack model and there's my contact information and that's all that i have do we have any questions
so this is brand new we built it first we went through daws math and and did what we needed to do to take it from the beautiful math that it is into something that could be implemented in a spreadsheet and in the model that i wanted so that's being peer reviewed and so no it has not been implemented but in the paper that had to be submitted there were eight evaluations that i went through documenting and in that process is kind of like writing a thesis so in order to write the white paper i used historical data sets that are well known and have been used before for modeling these kinds of things improving these kinds of things i used an online
system that tracks threats and i pull that data from a snapshot and i use that i pulled historical reports for worm activity and how they grew so i took there were eight that i went through and then explaining the charts and in order to also have this justified you also have to show that the model acts predictively and that it doesn't get something calculate it and give you something that's highly improbable of happening and so within the model and within the math you have to kind of put rails on what you can do and so there are limits limiting factors that are in the math and dog use the same sort of thing so that's where this
model sticks sits right now so it has not been implemented um but i'm very excited about it and i just wanted to share because i thought it was really cool i thought it was very cool um but that's that's where it sets and and it's being patented so so it's got the historical to it but we haven't implemented it yet but i would love if somebody wanted to do that work reach out and talk to me do i have any other questions yes ma'am um is your friend accessible yes if you go on my linkedin you will get the public simplified version that doesn't have all the heavy mac the one that has to go
through you has to have all the math right yeah is there an ability to get to the heavy map oh just hit me up on linkedin and when you go to the top of my profile scroll through what's pinned at the top and you'll find it right there you're welcome any other questions yes sir have you thought that your mom was a natural enterprise i'm sorry you're going to have to speak up for me i'm part of hearing that no worries so i am marketing it and this is one of the ways that i do that i purposely didn't want to do what we think of as an enterprise model that's in the cloud i don't want you to put
your vulnerability data in a cloud and i don't want to put it in a cloud so i purposely wanted something that had no macros no vba it's on a laptop it's an excel you can put it into any environment so you're responsible for your data i just show you how to do the analysis does that make sense but yes this could be used small business government environment enterprise where you use it across and that goes back to and i know this is sounding kind of self-serving but the reason i wrote the book is because this kind of analysis a lot of people think of this like it's compliance one and done it is a heavy lift because
that's what you see happening in the industry and i think it shouldn't have to be that way i think this should be something that anybody can ask and answer a question at any point whether it's operations an admin a business level manager wants to know something about what's the likelihood that something could happen that would impact my operations and put me out for four hours you should be able to ask and answer a question like that within your organization in a quantified manner and this is not what the this is not how we're doing it now and that's something that i want to change so i wanted it to be fast easy accessible that anybody can use written
in the language of cyber all you have to do is look at your data develop the parameters for what you think your forecast is and then over time check your forecast and so here's how you do that whenever you create a forecast you create an estimate along with that and you see this in project management anybody involved in project management they have a variation it's called a pert model which is the most likely is just weighted more heavily other industries do this we just haven't been doing it and so i wanted people that to have a way to be able to do this so that as things occur you can easily go back in and update it you can always know if
your model is valid if you are within that five to ten percent range that when you create your estimate you so i think this is my estimate plus or minus five percent as long as you're within the five or ten percent your model is solid when it skews out of that go back and update your data the model is calculating correct data has changed right makes sense any other questions yes no sorry no you're fine i'm watching the clock over here
what about it
like
no that would be an interesting and lengthy detailed project i wouldn't discourage that work i think there's value in doing that work i would caution now i i've been in this industry for 30 some odd years and i've done just about everything in the industry from building appliances from scratch protocol analysis dna i've done all this stuff right and i know that we have a tendency to want to dive deep into the details this type of analysis has more value if it's lifted a little higher up as i said before and you're looking at kinds of things with similarities you will have a broader reach that way than if you tend to dive really really deep
but i don't discount the value of doing that i think we all want something that's a push button solution this kind of work isn't designed to be a push button it's designed to be a an intellectual thought process to help leadership make decisions remember that's why i said don't underestimate the value of an initial estimate there's tremendous value there and that's really kind of who this is speaking to and who you're doing it for right so you would put something like this together so that they could help make a decision and justify what you need that makes sense because now you've evidenced it and you've done it in a way that is repeatable and defensible and in
the language that management understands and to this you would tie whatever the impact is whether that's an outage financial loss of reputation whatever the impact is in english to you you would tie that to this piece of the analysis that makes sense any other questions six minutes if not thank you and i hope you got something useful out [Applause]
Related talks
 20:26
20:26 20:12
20:12 38:25
38:25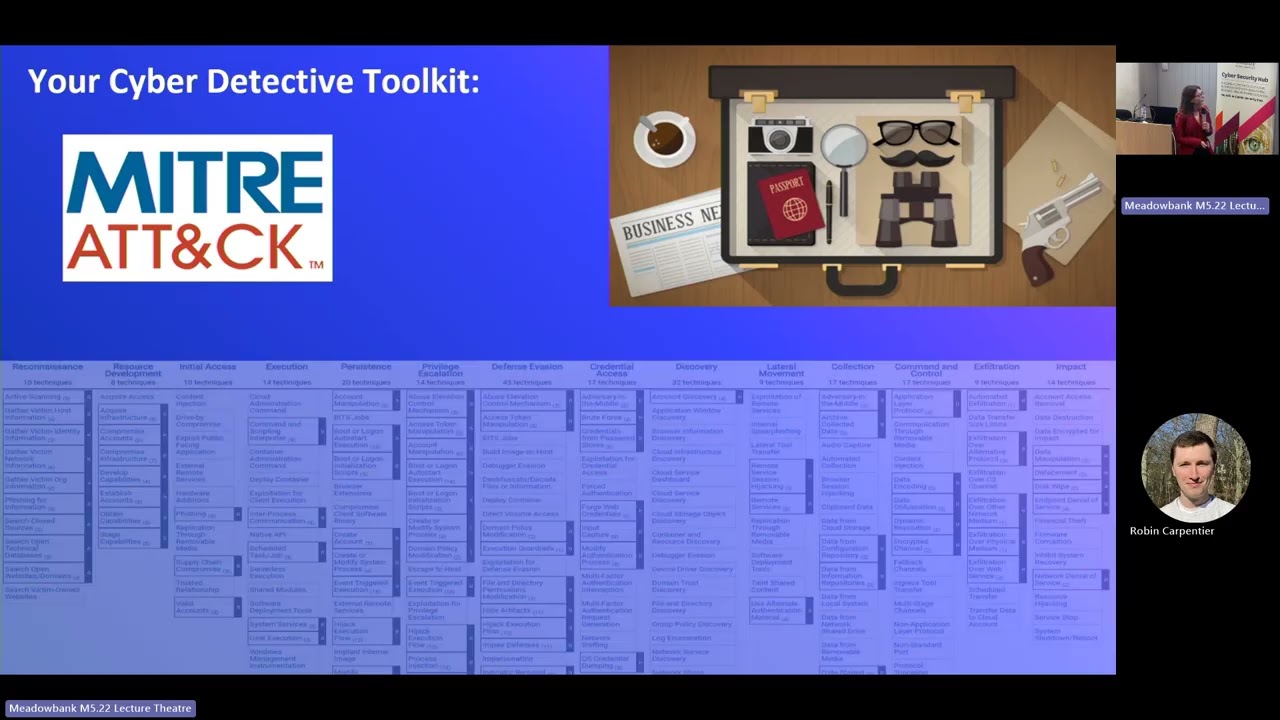 33:30
33:30 41:49
41:49 45:48
45:48