GT - Attack Flow: From Data Points to Data Paths
Show transcript [en]
all right good afternoon welcome to b-sides las vegas ground truth this talk is attack flow from data points to data paths by gabriel bassett um a few announcements before we begin we'd like to thank our sponsors especially our diamond sponsors lastpass and palo alto networks and our gold sponsors amazon plex track and blue cat it is their support along with our other sponsors donors and volunteers that make this event possible these talks are being streamed live except of course in underground and as a courtesy to our speakers and audience we ask that you make sure that your cell phones are set to silent um questions will be at the end if you have a question use the audience
microphone so youtube can hear you i am holding that mic i will put it back on the stand in the middle of the room uh as a reminder the b-sides lv photo policy prohibits taking pictures without the explicit permission of everyone in frame all the talks are being recorded again except in underground and will be available on youtube in the future please keep your masks on at all times uh if you want to hear better see better feel free to move closer to the center and front of the room keeping social distancing in mind um with that let's get started please welcome gabriel bassett it's good that we get the clapping in now because you don't know what i'm
going to say and if it goes bad at least i've gotten one clap for the presentation so i'm gabriel bassett um we're going to talk about tag flows so we're going to do a quick introduction to it and then we're going to do this like in the data driven way right i'm going to show you a bunch of data particularly data we use in information security before like attack flow what it looks like now and then we're going to kind of walk through the process of taking data and turning it into attack flow and then we're going to look at the data structured as attack flows then we'll wrap things up a little bit and so
who am i um this is me this is my twitter handle i have done a lot of graph things and i want to take a second to talk about where that comes from because i've been doing graph stuff for about 15 years now and it started when i was in the government um when i was in the government we were doing risk models right and so this is like way back because what we did is we came into our executive and we said hey we ran nessus and we showed the output of nessus all of the output analysis and it's a little too much and she said go back and find a better idea so we came back again and this time
we group things we said this thing happened this high risk happened 100 times this one happened 50 times and she goes that's great i i don't know what that means right like so what so okay we go back to the drawing board we come back we got like the five by five chart right that has impact uh likelihood and impact on it and it's got some red yellow and uh green areas and we go now we know this this wrist is right here right um the problem was we never could agree because it wasn't just like one person making this decision like i was representing the government i had a contractor doing the testing then there's the people that built the
system and their government representative and we all disagreed and the problem was why do we disagree like why can't we all just get along well it turned out that it mattered on how you made assumptions like when my tester makes assumptions they would make the assumption of like hey here's the server the power button isn't like covered by a door or anything what if someone walked in and turned that off this is a really important server that's a high risk now understandably the other side of the government's contractor said yes but that server is inside of a room that has its own um access system and set of credentials it's locked down to like 20 people and
that's inside of this portion of the building that is only locked down to the people who can get access to it which is inside of that half of the building which is locked down which is inside the building which has its own access which is inside the fenced area of the base which is inside the base and so really the threat over here is probably not what we're worried about we're worrying about the one out here and see the idea is there's a path here right the narrative for the threat outside the building was very different from the threat inside and so we realized or i realized hey we need to be writing that down
and so i did what everyone does when they first start to do this they get an excel spreadsheet and they say what's a is a threat inside the building or not if you answer yes it's high or we add like you know 10 and if it's no we add 1. we come up with a bunch of questions like that and then we add them up and maybe we multiply it by some random number we came up with because then it looks prettier and then we say any number between this and this that's a high risk and you know these are the lows and that doesn't work and i apologize if anyone in the room is actually still
doing this a lot of people do it's not just you um but the problem is people already know what they want the risk to be and after a few times using these kinds of tables they know how to get it out and so they come up with some narrative that fits their mental model for what that risk to be i want it to be high so i know i select this this and this thing to make it high and so now not only are you not getting the narrative you needed you're getting some false narrative and so i said well let's let's scrub that we'll go back to the pi by five but when you
put that dot on that five by five matrix you're gonna have to shoot tell me why you're gonna have to write out a little paragraph that says i think the threat does this and then this thing happens and then this and then and when i realized we were writing out this is where i started to kind of get a little bit different from what we'd normally do today and we realized that what we're really documenting was this attack path right the attacker does this to this system they do this and it has this effect they do this it has this effect a sequence of things and so we started to build paths and that was actually really cool
because once you start building path paths you start asking this question what does that mean in context it's cool if you've got one what if i have 10 what if my 10 all include the same thing how can i combine those together and i remember this moment really clearly i'm kind of grappling with this idea it's the end of the day right everyone's kind of tired it's me and this one guy there left like i'm walking past this game he's like hey i know you've been working on that problem my company had this project a couple of years ago that involved [Music] these things called brass i'm like cool what's the graphic because i don't know
like he had no clue but he he kind of he understood enough to know that it might apply in my situation so i go back home and i started searching for it and it turns out it's a really great solution by the way if you don't know what graphs are we're going to talk about that three sides um and so i go back and i build um bayesian inference networks in the back of an excel spreadsheet which sounds like a bad place to do that until you realize that i was in the government and they don't let you install things in the government and they really don't let you install programming languages because then you
can run whatever you want but they do let you write visual basic because it comes with microsoft office [Music] and so that's where i built this and i left the government after a while i got a patent around graphs i wrote a bunch of blogs i published some stuff i've done a couple of talks and that brings us to today and so it's been clear for a long time that atomic information atomic infosec data is not cutting it right we need to be able to describe the paths and graphs that graphs attackers take you know flows so to speak but we lack a common language to do that attack flows that common language it's a
schema for storing paths and graph data and it's really cool because it's incredibly simple and it's incredibly strong and before well if anyone wants to clap and and tell me that i was great at doing this now that's awesome because on the next slide i'm going to tell you there was actually a team of people that did it um this was something done through um fighters uh center for threatened form defense with um like raj attack iq great uh gauge anomaly apollo at fortinet market city ryu and fujitsu andy who's now at apple market title and we we were lucky we had many of the right people um ryu worked on this stuff back like in his phd years in the early
2000s like and then this guy is like so smart that like i just sit in aw um but he he could be wandering around here and he's so mild matter that like you know he he passed by we would never see him but he's so smart and so awesome i love ryu andy was instrumental in writing caldera mark was instrumental in writing six and of course i've worked with brass for a while and i also maintain the vera schema for the used by ryzen for the data breach investigation report and so it was this team of people that did this and so what's what's it look like and so graphs are these mathematical things that
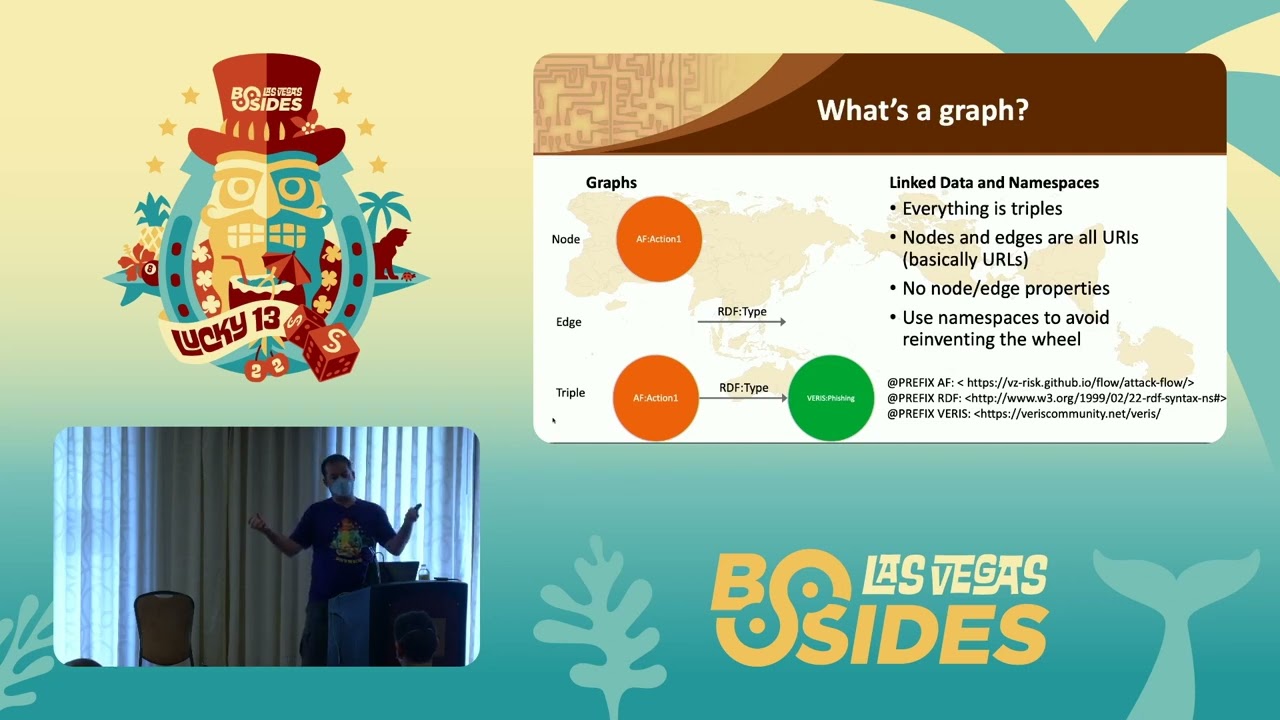
they're actually pretty simple they're made up of two things they're made up of let me we're at c should i just push buttons to figure out which one's the laser or should i actually think about it ah yeah there we are there we go it's made up of dots it's made up of lines for graphs and so the idea is that the dots are nodes the edges are the lines every edge has to have a node connected to its ends you can't draw a line in a graph and have nothing on the end but nodes themselves can have multiple or even no lines so this is a graph this is a graph this is not quite a
graph because there's no no time and there's a lot of different types of graphs um there's simple graphs like you know there's no direction you know you don't know which ones to start at the end of the edge there's directed so it goes from something to that's why we have this little arrow on this one there's tree graphs there's acyclic graphs there's cyclic there's directed acyclic graphs or dags which come up a lot in a lot of kind of different situations there's also hyper graphs and property graphs but we're going to talk about a very specific type of graph we're going to be talking about linked data and that means a couple of things the first is that every node in edge is
defined by a single string a single uri specifically and so every edge has a uri and this one it's rdf type and i'll explain the audio thing in a second every node has a uri this is i think attack flow action one or varus phishing um the only time you don't have those is when a node is a literal so an actual like a bunch of actual string is not a uri or a number something like that and so you combine those into what are called triples here we have a triple of attack flow action rdf type embarrass and it's just three things right like you can see a table with three columns and you put edges in there
and you have your triples and you have your graph um but you'll notice right that i didn't spell out a tag flow i defined a test flow over here as you know the af means this uh namespace and namespaces are one of the cool things about link data because you don't have to reinvent the wheel if someone else has an entire definition of how to explain things such as actions or assets you can just use that you don't have to come up with your own um in fact a lot of it's predefined things like rdf define um this is a type action is a type or actually that should go the other way fishing is a type of
action or action is a type of fishing um there's other name spaces you'll see a lot and i'm going to bring these up for a specific reason so like rdfs is used for labels so if you want to give your name node like a common name or something that sounds a lot better than you know uri blah blah blah blah there's dublin core that adds things like here's the description for the node there's time for time stamps and there's al web ontology language and it has a lot of useful things like this node is the same as this node or this node has an object property or a data property of this thing or this
is a named individual like there's phishing the concept and then there's the actual phishing action action that happened as a named individual and the reason i bring these up is because you know if you go back and you go google this or if you're googling it right now it's going to scare the vaginas out of you because al does scary things because the people who invented al were a bunch of academics who were like you know what's cool we can do actual cool reasoning over this um we can do first order logic we can do all these fancy things and we come into and go you know that's cool and when we need to know that we can
know that what we want right now is to say that one node is the same as the other node like we're using this much of this big thing and we don't have to understand that big thing it doesn't affect us in any way um but the nice thing is you have this name space if you have a data set and i'll explain this a little bit later but if you have a data set that includes something like the city of sydney you don't also have to say that sydney is in australia that australia is a continent and that it has this location someone else has already built a graph that explains all that stuff if you
reference their sydney node then anyone that wants to know that stuff they'll be able to find it so now we know what graphs are right what about attack flow attack flow is five things actions assets properties relationships and flow so the action is the thing that happened the asset is the thing that has its state change properties are these nodes that describe actions assets other properties things like that they're the descriptions relationships are just the edges between them and the flow is the set of all this together and so when we look at it as a graph it looks something like this we can see this causal path through the middle of it and one thing you'll notice here is that
it goes action asset action asset and that's very very intentional because we'll get into a little later but in security different people think about causality in different ways if i'm a blue teamer i think that i have an asset and this action happened to it because that's kind of what my logs look like um if i'm in on the red team i might say i did this which is an action then i did this which is an action and implicitly it's the assets that are between that i did this action there's like two something um but to be able to capture all the ways that we think about um security it's important to have these
and how they go back and forth we'll see some visualizations that show that later so now we're coming to kind of the [Music] fun part what's our data look like today this is the opportunity to look at a bunch of data but not use it um so starting with red team report right this is just something i downloaded off of pintestreports.com and what do we see here we see a lot of freeform text right not a lot of structure and really also not a lot of solid grouping you can't say like here's a concept and here's there's groping but it's all over the place so this is what our renting day looks like today now
tax simulation data a little bit better it's structured right it's a tree but a lot of times in attack simulation data you get a lot of raw code it's hard to describe anything more than a single thing without having some clear clone attacks this one single thing points to some code and what we don't want is we don't want to have to describe our attack simulations as like arbitrary code because we don't want to be like hey i need you to go run this attack simulation in your environment with your tools here's just arbitrary code have fun like we wanted something a little bit better than that um signatures right again structured looks very similar to
the attack floyd it's because it's like hierarchical data um but there's no real links we're seeing one thing happening in an instant you know and that's we want to be able to detect more we want to be able to test subtler things we wanted to be able to detect multiple things then we get into intelligence data right and this is a subset of an eye chart a very small subset of an eye chart these are two records just off of showdown right and there's some substantial problems with this it's super dense um also you have duplicate data so if i have like the same vulnerability down here i'm going to get duplication of references duplications of summaries
like those are going to be in every single record that references this vulnerability right that's going to take a lot of space but the biggest problem with this is that when we use these data structures we don't know what's in them and so this one like so over here this is an http test this one i don't think this one's actually an http it's a different test it's like the https test and there's nothing that says that they need to have the same information so if i'm looking at my dictionaries for key that's like five layers down in every one of my records it's not there in every one of my records and this becomes this huge problem as
you look through data if you don't know exactly what the entire structure of the data looks like you know and who wants to know the structure of all the data justifying the few things they want to look for i say this from profoundly depressing experience okay so moving on incident response data right this is all very textual it's all kind of these text files by the way big thanks to chris sanders uh and his training he donated the text files for this um he's also helped out a lot and so these are text files of indicators and information um that were collected during this uh simulated ir and the problem right is it's all text
even some of this is structured this is structured data but it's being stored as tests and there's nothing that links 222 to something in this file it's right there or over here or even in the same file other than like wrapping the raw text you know that's not very searchable that's not very usable you know you're never going to find that in six months [Music] and so moving on to like thread and tail this is uh some noise donate some data donated by grey noise this is actually pretty nicely structured it's relatively clean this one is but you know you can end up with raw data scanned this one they scan two ports what if they scan every port right
then you get this thing that's like this big um also what if you have 40 000 of these um and you need to find every place that 23 is mentioned um do you really want to look through 40 000 pieces of data to find the one everyone that's got you know port 23 in it and even when we aggregate things like threat intelligence like i like to think that this looks good i like to think that because i made it um you can all tell me that it looks good you don't have to believe it though um it's all aggregated and it's pretty it communicates it's clean it hides a lot of nuance because of that
aggregation and we'll see that a little bit later you know but even keep moving up the chain let's say that we're making decisions about our architecture what we're going to invest in you know how do we do that these days we make it one endless you know at an organization i was at the way we did is the entire security department could propose projects and they said hey we think it'll cost us much here's some text maybe a paragraph explaining the benefit we expect to get from it and we build you know one endless and at some point the money runs out you draw a line and you find this stuff and you don't fund
that stuff above the line below the line um the problem is there's no context to it do we know the email filter plus a phishing reporting button do those really we want to buy those together are those complementary are they duplicative and what about the discussions at the executive level right um a new uh exploit's being hit right software x has been used in breaches and you know those companies look like us and you know the executive team says well are we at risk we say we could be um we really don't know right we know that we run the software but we don't know if we're at risk because we don't understand our context
and so there's a lot of problems here right um often our data is just blocks of tests it's hard to parse it's hard for people to parse it's hard for machines to parse it's hard to get value from because the person has to be able to look at it and pull out the pieces and organize them in their mind because they're not organized in the text and if you can't do that in real time when you're looking at it what are the chances you're going to be able to find that later on and put it to use you know we've got a lot of structured data most of it's structured either tabularly for logs or hierarchically and that's better
but a lot of times it lacks links hierarchical data is not good at building sequential links of things it can tell you something and then tell you things about those things and those things you tell things about it doesn't say this thing is related to this thing is related to this thing um also it lacks that context you either are putting too much context in because you're duplicating every one of your records or you have too little context because you can't go find the additional pieces of information about them because they have to be in the record and if you do have all that context in your data and all this structure it becomes so complex that you can't find
anything you need a search engine just to find minor things in your data and so attack flow improves infosec data and we're going to go through this as an example to see how that works i like examples so we're going to walk through it so we said attack flow is like a schemer right it's not a tool it's not a solution it's how you structure your data and the schema itself lives as either a json schema or as a graph um we also have data and this is a good example because anytime you have actions assets in order you can create a flow um and it can be in incident response reports red team reports really any of
that data we just looked at but these are two good examples because if we look over here if we look at what's happening in the ir report it's very asset centric the mail logs show no proxy and hosts blogs detect where a red team report starts with we fished right we installed it starts with the action happening and so it's two different ways of looking at the exact same thing but now we have our scheme and we have our data and you know i assume that everyone knows exactly how we need something to put them together which is nice because we actually have that tool um uh michael uh corenzo i i agree with things um put
this together as part of the mitre project um you define your action and you define the mandatory properties for it you'll find your asset in the mandatory property and then you can add additional properties down below and these are all just kind of point and click in the user interface to build this out and once you've built it you can export your data as a tag flow so we can export as a json schema and the nice thing here is the actions are grouped together assets are grouped together properties are grouped together but i really prefer data as a graph and so still it's a graph stored in json but it's a little bit different it's
just a list that's what a little flat bracket tells us each thing in the list is a node so the id of this node is action one and then for every one of the properties the key is like the relationship and the values are the other nodes and so action one is a named individual it's a type of phishing and it's a type of attack flow action we can also say the vector for it was email or the description is the actor phished a victim no things like that and so if we want to know what a node is connected to we can just go to that spot in the file and then we take that graph because
let's be honest none of us want to work with json directly we want our machines to work with json and we put it into a graph database this is auto text db graph or auto text graph db this is one of the many many tools you can use for this there's tons of graph databases out there i like this one because it has a nice ui it's got a nice api and there's a good free version of it and it works great for this kind of data but you know you we said these are these are just triples you can put them into a relational database or any other type and we can see where this happened right
we still have our causal path we have actions that lead to assets which lead to actions which lead to assets we have the properties a couple other properties and we have our flow note up here but looking at it is fun and you know i probably could spend a bunch of time up here just showing pretty pictures but the reality is we want to use our data and so we take that data and the cool thing is it's in a database it's not just living on its own in some file we can now query it and so we can say on the left what assets have been compromised or on the right and i know this isn't
readable what actions have been taken but we don't just stop there right because we really want to know things like what assets were compromised in a certain window or which action is taken most often but that's this query this is in a language called sparkle which is a standard graph query language but if you were storing this in a relational database you'd be acquiring a sql or you could be created with gremlin or cipher or kql depending on what you're storing your data in anything the nice thing is how flexible data is and so you go find what you need in your data and not just in individual pieces you find it in all your data because all
your data is living in the same place so going back to our challenges right instead of a lot of text we have nodes that represent a single concept instead of complex json tacflow lets us represent the parts that we need however if there's more context we want we simply link to it somewhere else someone has probably described it we can go and bring in their knowledge as well the relationships are a uh clear and explicit you know we know how to connect things we can show causality the paths the attacks take right something we weren't able to do before and so let's go back through our data and see what it looks like now that
we've turned into tackle we start with red team data right it looked like this before now it looks like this this no one in this room is going to look at this and understand what's going on this everyone can look on right the red team started with email and phone they fished one phish to the other it compromised the person who made the error and gave out their personal information or installed malware on the user device this led to credentials and installed malware over here the sensor exploited a vulnerability internally on these two systems one allowed for additional directory transversal which compromised phi you know and not only the cool thing is not only is this much more legible this
gets fed into whatever tool you are using to store this data this data isn't looked at once and then left on the cutting room floor it lives in your context for your organization to use this nice structured data did you get it okay um looking at tax simulation data this is a really fun area because right now it's kind of you can simulate basic things and we can write a bunch of programs and do a bunch of stuff in sequence what if we could do it dynamically right and so let's say that the attackers start with the domain and email and so what you do is you match into your graph what little sub graphs or
patterns match what data i have well network discovery does and so we're going to do the discovery maybe we discover an rdp server over here if we have email well the action that matches that or one of our actions matching that's going to be phishing and so that compromises a person who makes a mistake and compromises the credentials back to the attacker and the cool thing is after this happens and this happens you go back through your list of potential actions you can take and you see which other ones match in the graph because we have compromised credentials and a compromise ip server we have a match and so we take another action we use those stolen credentials to
compromise the rdp server you know the same way we think is people we can now document that and have machine okay i'm sure everyone like then things like but do we really want to do this and you're absolutely right we probably don't want to do this but you can do it i want to get in trouble for this one um signatures right our signatures are pretty static right now what if they could be a little more dynamic a process creates a file that same process runs that file the process of the browser and the file isn't living in a place a browser should put files right now we don't have to base detections on individual
events and the reality is there's a lot of organizations that are doing all already but a lot of it's done in raw code and things that are not communicatable what we want is something that's communicated we want a rule that i can then send to someone else to say hey can you test this to see if it works you know can you test this within the system our intelligence it is convoluted we can take it now and we can look for the parts we want let's say that i want to know about this vulnerability right here and so i search for that and then i double click that and it says hey here are the instances of that vulnerability
that exists and i say great show me the interfaces that others are found on it's found on this interface and that interface and that interface which is found through these scans on these assets and we can click through we can do it and the first couple of times that's going to be really cool and you're going to enjoy that it's going to be a lot of fun um after the first couple times you're just gonna write a query that says hey tell me every system that has this vulnerability on it and it's gonna dump it out for you it's gonna find that context and you can link in context from outside your organization if you want to know the physical
locations or things like that our incident response data very messy useful from a human perspective but not well useful later on what if we take that data and we put it into markdown we're defining an edge right here because we have a source a relationship and a target let's test in markdown now we have that we have our incident response in our graph in our structured data this could potentially be living with your intelligence with your renting data now when we go and look we can go find the things you want in fact we can bring in that structured data that we had during our incident response and bring it into the graph directly and
then output from the graph back into our markdown allowing us to both work as kind of text as well as as structured data oh and this is um let's see this on the left this is onto text graph vegan and obsidian and i'm trying to point out tools as i go because i want to really impress on you that there is so much ecosystem that already exists around this stuff um looking at the additional the grain oils intel and there's a lot i like i think i parse through an hour of data in like 46 000 records um let's now we can go and explore that you know i can go search for the vulnerability i want i can find every
thread after using it and i can click through those things and then of course my data right it's like it's pretty but it's hiding some things um this is what it looks like on top and this is just what a subset of it looks like when you go start looking at the paths the attackers are taking this is not fun to look at either this is very messy we'll instead look at a subset of it well now we're starting to see hey if i'm an engineer trying to figure out where i want to apply my mitigations maybe i'm starting to understand that i want to put things on my server layer because it looks like my aggregated
attacks are mostly coming through my server layer either as a malicious action probably using credentials or as an error but this is still a little dirty what if instead i start to look at the path even as a couple bar charts i look at what action happened first what actions happen the middle what's happening last i'm adding additional context that i didn't have that was obfuscated when i looked at this from a point of a single bar graph moving on to the budgeting right we just kind of picked our one to end list now what if we go and we build out the attack flows for it now we're saying okay this mitigation right here helps with
this right vulnerability management probably helps with all of our servers two-factor authentication probably helps where we authenticate email filtering helps where we handle emails now we can put this together and say hey what we want to do is we want to do a couple of things together as a group because they add together they form kind of a single boundary and then we want to do these two things together because they form the next boundary and then the next thing is to form the next property we can make decisions about mitigations that complement each other and finally that discussion right this kind of awkward discussion that many of us have had in some form or
fashion what if instead of saying oh this vulnerability is happening we said this attack path is happening and when we ask are we at risk we say well we went back and we looked at that path we pulled that path out of our data and we've tested our phishing defenses and we've tested um our malware response and the likelihood of malware saying on the system is this number the malware likelihood of being fish is this and when we add this together even though we know that we're vulnerable to the exploit the overall path is low and we can say that confidently because we queried a data set that we are storing that's storing information about the
structure of our organization the story and information about our red team results and storing information about what assets live and what the likelihood is from our phishing results and so there's even more benefits we get from the ecosystem itself all this i've done with like open free stuff but the nice thing is like academics have been working on rdf for years and years and a decade plus now and they built a bunch of stuff like that's the good news the bad news is they built it all in java but you know you can live with that um there's databases there's graph databases there's every other type of database there's huge numbers of file formats if
you like your data tabular you can do that if you like your data in xml i'd like to introduce you to other data sites but you can use that there's json tab uh tab deleted human readable things you name it there's a format that fits how you want to use the data and then because it can be structured however it can be stored however and there's even like api tools there's validation tools there's programming tools visualization tools editing tools querying tools analysis tools all these things already exist for us because we're working in a known ecosystem and there's huge stores of data there aren't great structures for um security data there are great structures for every
other type of data in the world in fact like this is this data set that are the data structure that google uses to build structured data into web pages you know and it's all machine to machine readable we don't have to be in the middle of it and that's good because the reality is not everyone wants to be looking at this kind of stuff there's more we can add we can define sub flows so i can say this this subset of things happens often to me does it happen often to you we can both define those and say what things are common between us and so going back to visualization this is important because the first place
people want to approach this data is as a visual graph if you want to know more about visualization i gave a talk on a microsoft bluehound 2019 graph visualization and one of the things is that after a while you don't want to look at graphs you just want to use the data but it's important to kind of go through an example here this is something i pulled out of a threat report have a nice graph like and right but you read this you're like hey i know more things and if i were to ask you okay go put those into practice you're gonna go well i guess i patched this right i go well but how do you go how are you
gonna apply this to your system and then well no right like i can't apply this graph i comply knowledge i gained from it i can't apply this but what if we go structure it as a tech flow the attacker exploits something over here and i've left out the properties but you can define the type of exploit on a server which then using data that it also sent runs a loader which then adds code we can look at this from the attack team perspective there's the other side later you can take a picture of and here we're looking at just the actions where the server the asset is the relationship between them and so this might be how a red person wants to
think about it you know the blue side might want to think in terms of assets with the actions being on the edges you know i'm thinking about what's happening in the server the data and the code being loaded and then finally you can look at it all back together and one of the things that i want to add is if you look at it all together you get to carry this additional information and so you can say not just these things are related but here is the requirement for this exploit to work right and here is a state change imposed on this server and the server being compromised is a requirement for the loader to run
and you can put this data into a structured data set where you can analyze it and use it with all your other data you can share it with other people you can get their data and we can all actually put things to use but you may not want to always look at it right like you start to get complex attacks and they start to get busy um there's a few things that are important for visualizing this kind of data like grouping together nodes um or putting box but you know what i want to do i want to display it like this i've got my assets i've got my actions as lines i can build this as an interactive visualization i
can scroll around in it this is an easy way to show the same thing just because we're using grass doesn't mean we have to look at grass you know and that's important because as we go into the future right this is a schema this is not your single pane of glass this doesn't solve all your problems it's a foundation to build on and that means building now it's possible to build bad things on a good foundation like i don't want to give you like i'm excited about this you know you may be too i don't want to set you up and have you feel disappointed because there's things to be built right and some people don't want to
build things right some people just want to like buy the finished house and that's okay that's how homebuilders make their money as my homebuilder knows [Music] so that's okay and not everyone's going to get it because the prego paper that you know google published years and years ago they described thinking like a node and that's not something everyone wants to do or anyone can do and that's okay a tactile can meet you where you are and so to help people with that we're working on things like documentation you know we showed you like here's what the day looks like before and after i'm working on getting your documentation so that you can do that process yourself
we're also looking at building training so you know i said hey you're going to enter information into this web app you know i want there to be videos so you can watch someone else do it to help train you on how to do that and then we're working on improved tooling and that means more and quicker ways to enter data it means easier ways to query the data if you've ever seen the dot links uh storm query language i really like it at mirrors r's implier verbs it's a great query language i'd like to see that usable for a tag flow and it also means better visualizations easy push button stuff for whatever kind of user you are whether
you're a red team user or blue team or an executive and you know while we're talking about things the future we want to talk about maybe some of the more advanced things right because we said action right there's nothing in there that says it's attacker actions we're using it that way but what if i describe normal behavior as actions i can start documenting how my system normally operates or what about interdependencies um haas keynote um i assume i was running pbj and i missed it talked about how what i would call what he calls resilience what i would call blast rate is the effect of one system having an adverse state on other systems that's just an action this system
changes state that has an action of changing the state of another system you know this one's availability is compromised that one is this one's integrity is compromised this one's a table we can start to build that blast radius as a structured set of data or even response right i can say if this system is in this state i'm going to take this response action you know and document that in the exact same language as we've documented everything else and that opens up a lot of opportunities right the first is just structuring path data right now all of our data is logs and it's all sequential what would be great is if we actually were given the
causal paths between our log events and i actually know um some organizations that are working on it um additionally you know what if we weren't companies that can provide enrichment so i mentioned vertex they sell enrichment what if you had your organization's data structure you didn't want to really store all of the say the attack techniques and stuff what if you just wanted to call into someone else's database of what all the threat actors were so when you saw this ttp you go just query theirs and you link their data into your data and it looks like a seamless graph database from your perspective but on the back end it's all being linked together from
all the other disparate sources and then what we need better analysis there's opportunity to write analysis against the data and there's opportunity to build automation automation of red teams automation of defense and blue teams and finally for incident response there's the ability to apply things like link prediction so in graphs you can use machine learning to say hey given the graph we see there may be edges that we don't see and so we can say um we've done this incident response this is what we've seen so far this is our attack flow uh machine learning model are there any edges that maybe we missed and it goes hey have you considered this edge that this action was taken related to this
asset and that gives you another place to look in your response for things the attacker may have done that you didn't know about and so attack flow really is the next step in information security data and if you want to go get involved or go look at it these two repos are the place to start miters repo it has the json schema the builder a little bit of markdown to explain it also the bottom one is the graph schema as well as the code to convert between the two um and the reality is this is probably going to leave you with more questions or many questions um and so because this is very new this is
something that just was published in i think april reach out i'm here to help i want to see this i think it is really important for the industry to move on and how we structure data i get a lot of security data um i get a lot of security data and so the opportunity to improve howie structure data is very central to my interests and so reach out i can help i'm looking to help and i would love to open it up for questions but i've got 10 minutes to get back to pros versus joe's to help in their game and so thank you very much
Related talks
 51:51
51:51 32:48
32:48 33:48
33:48 54:33
54:33 31:06
31:06 20:51
20:51