Using DeTT&CT and the MITRE ATT&CK Framework to Assess Your Security Posture

Show original YouTube description
Show transcript [en]
my name is dave branscombe we're going to be talking about the tool called detect and how it works together with the miter attack framework to help you get a better understanding of your logging in your environment and what you'll be able to identify as attacker behavior in your environment so this is me so i do work for microsoft i work in what's called the global partner solutions group i'm a security compliance identity and now management lead so it's now skim i've been at microsoft for about 14 years i live in raleigh and you're welcome to come back connect with me on linkedin are there any microsoft partners here i'm sure some of you are microsoft partners
okay so so we work with microsoft partners to train them on the security tools that are available i'm going to try to make this as vendor neutral as i can but i will tell you how some of the things work with microsoft stuff all right so let's talk first about attack the the miter attack framework and probably most of you are already familiar with this to a certain extent mitre attack was developed by the mitre corporation back in 2013 and the the reason behind it was they wanted to document some of the common tactics techniques and sub-techniques that are being used by advanced persistent threats to attack windows and and other enterprise networks so it was really created out of a need
to document a couple different things that didn't exist in other frameworks so uh there there are other frameworks lockheed's got a a kill chain framework and and there's other ones you can use but there's something unique about mitre attack when you compare it to those other frameworks so first of all it was addressing four primary issues number one was identifying adversary behaviors so typically one of the or some of the things that um uh threat hunters would look for are things like common domains that attackers are using or ip addresses or file hashes things like that but the problem with that obviously is that that's easily changeable right an attacker can change domains they can
change ip addresses at the blink of an eye they can automate it so we wanted to look and or mitre wanted to look and see how do we identify the behavior rather than the specific indicator right secondly as i mentioned there were other adversary models or life cycle models that didn't really fit into what we're trying to do so the cyber kill chain concepts were maybe a little bit too high level two too abstract and so the miter attack framework was designed to give very specific behaviors to look for and how those behaviors were performed by an adversary it needed to be applicable to real environments so this is what we see in the attack framework is
what we actually see in the wild these are things that adversaries are actively using and it becomes more real world to us rather than kind of a theoretical concept and then the last one which is not a trivial issue is common text i can't read that speak up okay so we want to have a common taxonomy so so think about a scenario where you are um you're managing your enterprise environment and in that enterprise environment you identify that you've been breached so you call in mandiant you call in microsoft you call in the fbi whoever right they come in and you may have two different ways of describing the same type of behavior you may have two
different ways of identifying where the attacker is in the breach and so the mitre attack framework gives everybody a common taxonomy we all know what reconnaissance is made up of we all know what initial access is made up of we know what persistence is made up of and so these different groups that have to communicate about an attack can use this common framework for communicating the the aspects of the attack so attack stands for adversarial tactics techniques and common knowledge and if uh uh the the the way it's made up if you've seen the attack framework and i'll show you here in just a few minutes oh i forgot to check uh wi-fi but we'll
see um so one of the things that uh that you're trying to identify are the tactics and the techniques and the difference between tactics and techniques is a tactic is identifying why an attacker did something what are they trying to to do when they um are performing these actions so maybe their their goal is persistence in your network maybe their goal is exfiltration of data that's the why part the technique describes how they're going to accomplish that right so if they're trying to establish persistence maybe they change your startup folder maybe they modify registry keys that's the how of what they're trying to accomplish so that's the tactics and techniques part of it um just for those of you that may
be curious or are going to be taking pictures there's a link at the end of the deck where you can download the entire deck and and you're welcome to it um so in microsoft tools the this is the you know the sales pitch thing right so um in the uh the different microsoft threat hunting tools miter attack is becoming more and more prominent in in how we talk about adversary behavior so if you're using sentinel or if you're looking at sentinel in the hunting blade you see in the in the red box those are the um the the miter tactics that are identifiable uh using different uh queries and and so on if you're using microsoft defender for
endpoint our endpoint protection tool it will identify miter attack techniques in the specific alert so you get an alert on one of your endpoints you can go in and find out what tactic what technique is being leveraged by the attacker if you're using microsoft defender for cloud what we used to call azure security center it's available in the resource health so it'll tell you what what it gives you recommendations about what needs to be changed and why in other words what type of adversary behavior would you be preventing by making these recommendations by performing these recommendations so i said uh you know that the the mitre attack framework is a matrix this is what it
looks like so along the top those are the tactics right and it may be a little bit hard to read but uh you have initial access execution persistence privilege escalation and so on and then underneath those are your techniques so how the adversary achieves that objective and some of them you see have a like a little gray box beside them that just means that they're expandable in other words as as an example uh on the on the far far left side here in the middle uh the the gray box is talking about fishing so the sub techniques for that might be spearfishing you know and things like that so so it's giving you more specific types of behavior that an
adversary might use to to accomplish their goal there are different matrices in attack for different types of environments so it was originally designed with windows in mind but it has since expanded to cover mobile os's linux mac os cloud platforms like office 365 azure ad google you see here an example of office 365 and you can see that there's obviously a difference right in in the the number of tactics or the number of techniques available to an attacker in office 365 versus on a windows machine that they can you know do a lot more stuff on recently they also released version 11 of the ics attack framework so for industrial control systems they have an attack framework as well
so what else is in attack you can use attack when you when you dig into it there's different tools or or capabilities within it that can help you to identify who the adversaries are what type of behaviors they might be engaged in and and all this is going to play into later on we want to identify am i logging the right things for the adversaries i'm trying to defend against okay so in this case you can look up different threat groups what i've shown here is uh the cobalt group so the cobalt group is also identified as gold kingswood they're known as the cobalt gang cobalt spider it's it's good to know when these groups are linked together or
or that they they have similar tactics because then your coverage for your logging can cover the attack techniques for for a variety of different attackers it also sometimes will give you attribution so what country is involved or if it's just a cyber criminal gang that's kind of a hard one right attribution is not always the easiest thing to to provide but sometimes they're pretty certain that it's an iranian act or a russian or chinese actor and they'll they'll call that out but the thing that that's important here is that they'll also identify who typical targets have been so if you're in the energy sector if you're a government agency if you're a non-profit sometimes they'll call out
those industries as being particularly targeted by those groups and that can help you to frame and and shape the way that you do your logging in your environment if you know that these are the types of attacks that are being performed against your type of industry somebody have a question thought i heard somebody okay incidentally if you ask a really good question i got prizes um all the hands go up no all right so so let's take a quick look at the attack framework and hopefully my yeah i don't have a browser let me fix this real quick um what's the uh the wireless here i'm sorry i i meant to ask relics variety yes that works uh yeah
you can connect them i don't need anything super intensive just to make sure this works okay so this is the attack framework i'll try to make this a little bit bigger for you so as you can see um in this case uh if we want to take a look for example at persistence persistence is a is a pretty common one to take a look at so it gives you ideas about the way that an attacker will achieve persistence so maybe they'll manipulate an account they'll they'll escalate privileges from from one account to another or they'll move from one account to another maybe they'll change a login script or an initialization script they might create or modify a system
process and now if we click on the gray bar here it tells us some of the things that fall under that system process capability so some of this is linux based some of it's windows based right and if we you can also look in each of these individual well great i thought that was working i apologize folks
oh i spelled it wrong all right don't worry about it um what you can do i'll i'll get this this setup right here in a second
there we go okay so if we look at the whoops
up here along the top so remember i was talking about the groups so you can look at groups here and you can find the different adversary groups listed here so if we want to look at back door diplomacy for example so here it tells us that backdoor diplomacy has targeted ministries of foreign affairs telecom community companies in africa europe the middle east and asia tells us some of the techniques that are commonly used by backdoor diplomacy some of the software that they're known to use mini cats and quasar rat and so on right so so we can go ahead and look at those and then if we go to different tactics then the tactics tell us how they
accomplish these things right so how they perform this what the mitigations are and how you detect these things all these pieces come into play with detect so detect again is designed to show you where you have gaps in your logging that would help you to identify attackers okay so let's pop back into the the deck here and all right so just an example the the techniques and sub techniques uh here again you have the the fishing example with spearfishing attachments spearfishing link spearfishing via service it tells you the sub techniques but it also tells you which platforms may be vulnerable to this type of of an attack so in this case google workspace linux office 365
kind of everything then the procedure examples and the mitigations as we were talking about shows you how an attacker performs this type of attack what software they may have been using to perform this attack and then again the mitigations so mitigations are you know kind of iffy sometimes that they're very generic like in this case you know use antivirus and malware all right well probably most people are already using that but it didn't catch it so you might have to find some other ways of preventing this the detections are the important part so with detections all this information about attackers all the information about the techniques that they use the tactics that they use none of it matters if you can't see them
right if they're just operating in in under an invisibility cloak that's that's no good to you to to know all the stuff that they might be doing right you want to know how they're doing it and how do i identify it so detection um in the miter attack framework is what we're going to key in on with the detect tool so what is detect so detect is an open source tool and it's designed to help you i understand the quality the visibility the coverage and help you to identify specific threat actor behaviors it's made up of a python tool some yaml administration files the detect editor is just a web browser interface and then what we call scoring
tables so in this deck i have step by step exactly how to set this up i set this up on a brand new machine last night on this on this laptop starting from building my my hyper-v vm it was a windows 10 vm to the time that it was functional was about an hour and 15 minutes so and then most of that was installing the os right so it's not complicated and if you follow this step by step it will work i've done it several times just to confirm that i haven't missed any steps or overlooked anything so what it gives you in the end is something like this it gives you a heat map
of where your logging is good and where your logging needs to be shored up to detect certain types of behaviors right so where where you see the the the color coding is white that means you have no logging visibility for that specific technique where it's dark purple and in this case where it's dark purple it tells you that you've got good logging you're very likely to identify this type of technique it doesn't write queries or anything for you it's just telling you you've got good enough logging that you should be able to identify this type of thing if you're looking for it right that make sense okay so you might say wait a minute i have looked in sentinel
isn't there something like that in sentinel and the answer is kind of so there is a a form of a heat map in sentinel that does this but what it's looking at is do you have a rule an analytic rule that looks for this type of behavior it's not telling you whether the logging that you're ingesting is good it's telling you do i have a rule that looks for this okay so this is valuable up to a point but what if you're you want to go to your boss and you're trying to make a case for um you know you have to buy more storage you have to buy a different tool for logging what if
scenarios detect is much better at providing you that sort of information that will allow you to make your case right so yeah sentinel has some stuff but it's not uh in my opinion it's not quite as good as detect and you didn't hear that from me and it should be edited out all right so installing detect on windows the this is the the step-by-step stuff i know you're not going to be able to read it it's some of it's a little bit small on the slide again download the slides there's a link at the end of the deck and and i promise you it'll work so again i start off with a brand new windows 10 vm
on my laptop you install the windows subsystem for linux that'll give you an ubuntu environment on your windows vm so the way you install it is this wsl dash dash install dash d ubuntu you restart your machine one thing you have to keep in mind if you're if you're doing this on a vm as i was you may have to configure what we call nested virtualization so essentially what you're trying to do is is on your vm you've got a virtual machine and you're creating another virtual machine inside it okay that's the nested part so you have to configure these the extensions using the the powershell commandlet there that will allow you to configure or that
allow you to run this virtual environment for ubuntu inside your virtual environment for windows make make sense okay once you log in again the ubuntu environment will come back up it'll ask you for a username and password if you've only worked in windows make sure you remember linux does not like capital letters right so you have to use lowercase letters you know you can you can use whatever name you need it doesn't have to relate in any way to the windows machine that it's running on right it can be john it can be detect whatever but set up the username and password good practice is to update your distro so use a sudo apt to update and sudo apt
upgrade that'll get your distribution up to or your distro up to the latest uh latest and greatest then what you do is you go in so detect is stored up on github so you need to clone the github repository down to that ubuntu distro and that's the the command to do it it's a pretty simple thing that's that's the entirety of what it shows you on your screen and then you've got the files from the github repository in the ubuntu distro from there you're going to cd into the detect directory and you're going to install the python environment and the the steps for installing that python environment are there the last thing that you that you might
want to do is run this last command python detect.py and that'll just give you the syntax for the detect script right so it's not going to do anything amazing when you do that it's just going to give you syntax but that'll tell you that everything's installed correctly and ready to go again this part probably took 15 minutes right it's it's not that complicated so once it's installed you can uh start using the detect script to do detecty things right so one of the the easy things to do is run this python detect.py generic ds and that'll give you information about data sources so what data sources are are interesting in your environment or where do you get the most visibility
so as you look at this and again it might be hard to read from from back in the back but like the the top uh listed data source is command execution and it says it shows up 255 times in detect so one thing that you don't want to do is make the mistake of believing that anything that's low on this list or or that has fewer instances of the list on the list that it's not important right that's not the case just because something only has a few instances may only mean that there's only a few ways to do something but it could be something that's very bad so don't don't view this as a ranking it's
just giving you um an idea of how many times this data source shows up in in the attack framework um it's also important to know the kinds of data that you can get from each platform or service so for example dhcp right dacp logs are often very valuable you're not going to get dhcp logs from office 365 right you're not going to get dhcp logs from google workspace you will get it from your on-prem windows environment so this this table is kind of useful in just understanding where you can expect to get certain types of logs within your environment okay so what does this thing do how do you use it right so you've got it
installed you've got the environment set up it's ready to go what do you do with it so the first thing is you open the detect editor the detect editor is a web page it's just a very simple web page and on that web page you're going to create a yaml file the yaml file is going to be comprised of your opinion and i emphasize this is your opinion of the quality of your logging okay i'll show you a screw a picture of that in a minute but remember this is not doing an automated evaluation of your logging it's asking you how well do you think you're doing in this how well are you doing as far as
retention and then from there it applies that against the miter attack framework and gives you some information so once you create this yaml file you save it and then you need to convert the yaml file from from the ammo format into json format so attack navigator uses json so there's a one-line script that you use to convert the yaml into json format then you upload that json file into attack navigator so you can get the visualization so to run the editor it's just that python detect.py editor it brings up this webpage as you see here so as you as you see in the lighter blue you've got data sources techniques and groups there's different ways that you
can evaluate your logging i'm going to show you how to do it with data sources when you open the the data sources page you initially you're going to say new file when you say new file you identify what are the logging sources that you're going to be evaluating am i going to be looking at my windows environment am i going to be looking at linux am i going to be looking at azure id am i going to be looking at everything okay so uh that's the data sources that you see listed in green down there [Music] and then you give it a unique name so in this case it's just contoso logging so the way that the the yaml file is
constructed is this you'll add a data source over here on the side and you can either add all the data sources just automatically run through all of them or you can add individual techniques and and and data source uh things that are interesting to you so maybe you want to look at registry key behavior though so are they creating registry keys are they modifying them are they deleting them you can look at those very specific behaviors or you can say just give me everything the next thing you're going to do is say for that type of data source how good is my logging okay so down here you're gonna say uh when the logging source was was connected
and then um when it was enabled is it available for data analytics but this is the part that that makes up the uh the the bulk of what you're going to do you're going to evaluate the data source according to the completeness of the logging the timeliness the retention the quality of the log so you kind of have to know about your environment in order to fill this out right so so if you know you're not logging um you know your iis servers right if you know you're not capturing any of that log and then dumping it into your sim then you'd put the the the slider far down right you don't have uh good
logging in that on the other hand if you're capturing all the logs from your domain controllers then maybe you'd bump the the slider up uh further to the right and you'll go through all the different data sources and evaluate those what is the five characteristics of the the data next you're going to save the yaml file which is just this little button down here save yaml file and then the next step is you want to convert that yaml file into json format to convert it into json format again because you're using the detect tool and the detect tool had started the editor the the web page you need to stop that so you do control c to stop the
editor so you can kind of shift gears and run the script that does the conversion of the yaml file into json and that's the the the command that you run and what it's going to do is it's going to take that json file and it's going to put it in a directory on your ubuntu system okay so now you've got this file that you need on ubuntu and you need to get it out of that system into windows so that you can do stuff with it so the way that you do that is as you see here if you go to this whack wsl dollar sign in file explorer that is windows subsystem for linux and
that allows you to browse directly into that ubuntu subsystem and from there you browse to the directory where that file has been stored and just copy it right over to your windows system and then you can upload it into attack navigator make sense and if you want to run the editor again the the web page you just run the that same command python detect.py editor okay so now you've got this json file it's in your windows system or if you're using mac whatever it doesn't really matter you go to the attack navigator page and as you see here you're going to go to um open upload from local and then you find that json file that
you copied out of your ubuntu system you upload it into attack navigator and you get this okay so now it's telling you these are the data sources that you're logging for or or based on the data sources that you're logging for these are the different techniques that you can identify and it can kind of give you an idea of the likelihood that you'll identify these techniques based on the the the heat of the color right so that's not the only thing you can do however so you can export the data to excel so for example if you want to store this data and and have kind of a running history of how well you've improved the data sources or the logging
in your environment you can run this detect tool periodically and identify areas where you've improved your logging and it can kind of just be a you know an improvement catalog you can also be very specific about the things that you're looking for with detect so one of the things is identifying your logging coverage against all major threat groups so based on the logging that i have right now how am i doing against the major threat groups that are identified in attack right and so it'll give you a sense of whether or not your logging is good to detect that type of behavior if you're interested in specific threat groups so in this case we care about
fin 7 and the cobalt group so maybe those are or attack groups that you know are targeting your industry maybe you're in the financial industry and you know that those are people that you're trying to defend against so maybe you want to say okay based on the way that they act show me how my logging compares to their tactics right and it'll give you a comparison as you see here it tells you which threat groups you're comparing against you can also get a very comprehensive uh coverage so so where is your visibility and where is your coverage um or where you know maybe both right so let's take a quick look and hopefully my vm didn't crash in the meantime but
but i'll show you what this kind of looks like okay so this is the the the detect editor i go into data sources well i'll start at home there so i go into data sources in this case i'll say new i'm going to name it i'll call it b-sides nox here's where identify the platforms that i'm interested in so i'll say windows and i'll say add data source add applicable i'll say the date it registered was january 1st date it was connected was january 2nd yes yes and then down here is where i'm identifying the data quality right so what i'm looking at here is i'm i'm identifying this for all the data sources that uh that are possible
so i can say you know maybe my data field completeness so so data field completeness think about this just because you're logging something in windows doesn't mean you're logging everything you can for that specific event right so command line execution you may be able to capture that with sysmon but it's not captured by default in windows so you might say i'm not capturing all the data i should for this type of event and so i need to improve that so we'll say it's good consistency you know i'm getting it for about fifty percent of the machines timeliness pretty good we get the logs every day and retention we're storing it pretty well okay so now
i go back here and hopefully this will work right so save the ammo file now what's happened is the yaml file has been saved here's my detect editor you see i ran the the command once before but we'll run it again okay so it gave me this output of a json file so all i did was convert the yaml file into json now i have this json file that i need to get over into windows so that i can work with it so whack whack wsl dollar sign it prompts me ubuntu is the share then i go to home detect detect output and b sides two is the json file i just copy it over to my c drive
now i go over to the attack navigator let's kill this do open existing layer upload from local and maybe i did this right maybe i didn't wrong i'm not sure we'll see okay so it only gives me a couple things that i'm uh identifying in this case so i can i can find pass the hash pass the ticket type of attacks um any any uh uh some you know it's it's clear i've got some work to do in my logging right that's that's the key but it's giving you an idea of where you can start with with identifying the logs that are necessary so again this is very very easy to set up i set it up on a vm i could just as
easily have set it up on my on my machine but i don't want to mess it up and microsoft would probably scream if they saw me installing linux okay so to kind of wrap things up what does detect allow you to do it lets you score the quality of your data sources you get insight on the detection visibility that you have you can map your detection coverage map your coverage versus a threat actors behaviors and it can identify areas for improvement in your logging so you can increase your chances of threat detection so there's some good resources here this guy rob roberto rodriguez he's his twitter his cyber war dog he actually works for microsoft now he's in the
mystic threat hunters team he's got some really really good miter attack framework models that he's created so he's pretty interesting to to follow and then if you want the deck that's where it is right now so ak.ms besides knox questions
of get those data points on where you're laughing in detection is there any way or like any possible addition into like identifying what what is the most important organization now or is uh you mean like prioritizing which things you should tackle first um so the question was once you identify the gaps in your logging how do you prioritize where you should start and and and really that that's a that's a little bit of a tricky question i i would first start with saying what are the things you most want to protect right and if you don't have logging for those then clearly that's that's one of the first things you should do um but but yeah it's it
there is going to be some art and science to that kind of combined uh by the way here's your prize um so there are some articles that you can find on microsoft.com about things that you absolutely should be logging you know at a bare minimum i don't have a link to them on this but but those are things i would start with and then kind of branch out from there you know what are the what are the most important but also what are the most prevalent machines you know you have one linux machine or do you have 10 000 right so so kind of figure out which ones uh expose you the most uh oh yeah go ahead
[Music]
i mean there's so so the question is are there any other offensive uh frameworks that are on our radar um honestly i i i i don't have anything specifically uh this is one that we're focusing on with microsoft just because it's kind of industry standard and is well known so so that's where we're putting a lot of our attention uh let's go here this looks uh useful i'm having real trouble hearing i'm sorry if you um gave this assessment to different people on your team guarantee you'd get different results
[Laughter] how do you keep people from lying basically is a question
i'll agree with you so so the statement is how good can or how valuable can this be if it's based on your opinion and the answer is you know absolutely that's correct right so so you have to be um very clinical in the way that you evaluate your your logs right you this isn't something that you necessarily have to show your boss right this is kind of an evaluation of your own environment and you want your environment to be good so you know lying about it doesn't help anybody that's not a good answer i understand but uh but yeah maybe using some kind of a common information model to say you know these are things that must be
logged that might be one way to do it but but it's kind of informational more than you know a a real tool that you would use to prove something in your environment i i get what you're saying but i don't have a good answer ready any other questions i'm out of toys yes ma'am
um
i'm sorry i i literally heard very very very very little of that i it's very echoey um i i i can't hear i'm sorry come on up here so that's what i can hear
okay [Music]
is
um again i didn't catch everything that you were saying there but uh you're talking about the cvs framework and and asking for a comparison so so i i honestly can't truthfully say i've done a comparison between them so i don't know that i could give you a good answer
i think the the the the one of the advantages that i see in this and maybe cbs has the same same advantage this is open source it's free right you can download and do it just on a vm it doesn't doesn't take much time to get up and running is cvs free as well okay
oh okay okay okay yeah i mean i i mean i'm all for any tool that will help you identify weaknesses vulnerabilities i'm not like like i don't i don't sell this right it's just it's just a thing so um yeah i mean whatever works and gives you the information that you need use it anything else yes sir so just to be clear
correct it's just based on what you think your logging is i mean some of it is is verifiable like your retention you know you can say i'm retaining these logs or i'm not right so that's that's uh a pretty pretty clear cut one but timeliness you know what's timely
so yeah if you if you go to the repo it'll give you the the instructions for how to set this up in docker it's much harder to set up in docker than it is here so if you if you're not familiar with docker or you just want to get this set up in 15 minutes use this so that's just my opinion for what it's worth anything else oh yeah so uh what's the advantage of using this versus like if you have a scene that's got a plug-in yeah so so the question is what's what's different between using this and using a sim that has a miter attack plug-in if you have something like that that's
great one thing again what i would ask is can you do what-if scenarios with with that plug-in will allow you to to model um improvements in your logging to um to to kind of make a budget case with your with your boss or whatever uh when you defend the config file and you have the heat map you were able to hover over it and it showed some information does it break down based off of like source by source kind of where you're lacking and how it generated yeah so let's take a look so the question was when you see the the the heat map does what is some of the information it gives you there
so let's take a look at this user use alternate authentication so you see what uh and i know it's really really hard to read let's see if we can make it a little bit bigger let's go with phishing we can't
so if we go with pass the hash for example it tells you where this state uh where this type of behavior is identified in your data sources right so um you know you're gonna be looking for credential requests user account authentication uh request log on session creation and then um in this particular case uh it gives you an example of like what your coverage level is i'm sorry i forgot it's a question actually [Music] okay okay anything else hope this was useful it's a cool tool it's free might as well use it all right [Applause]
Related talks
 2:56:32
 34:13
34:13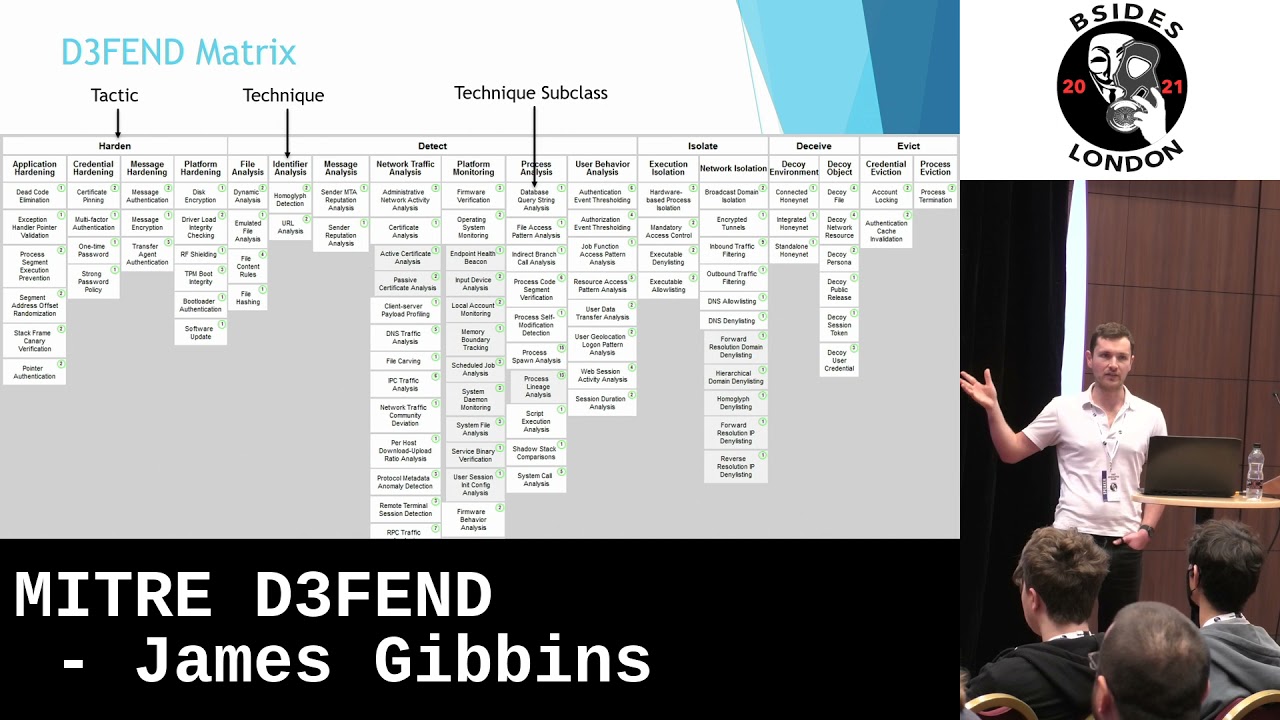 13:24
13:24 38:25
38:25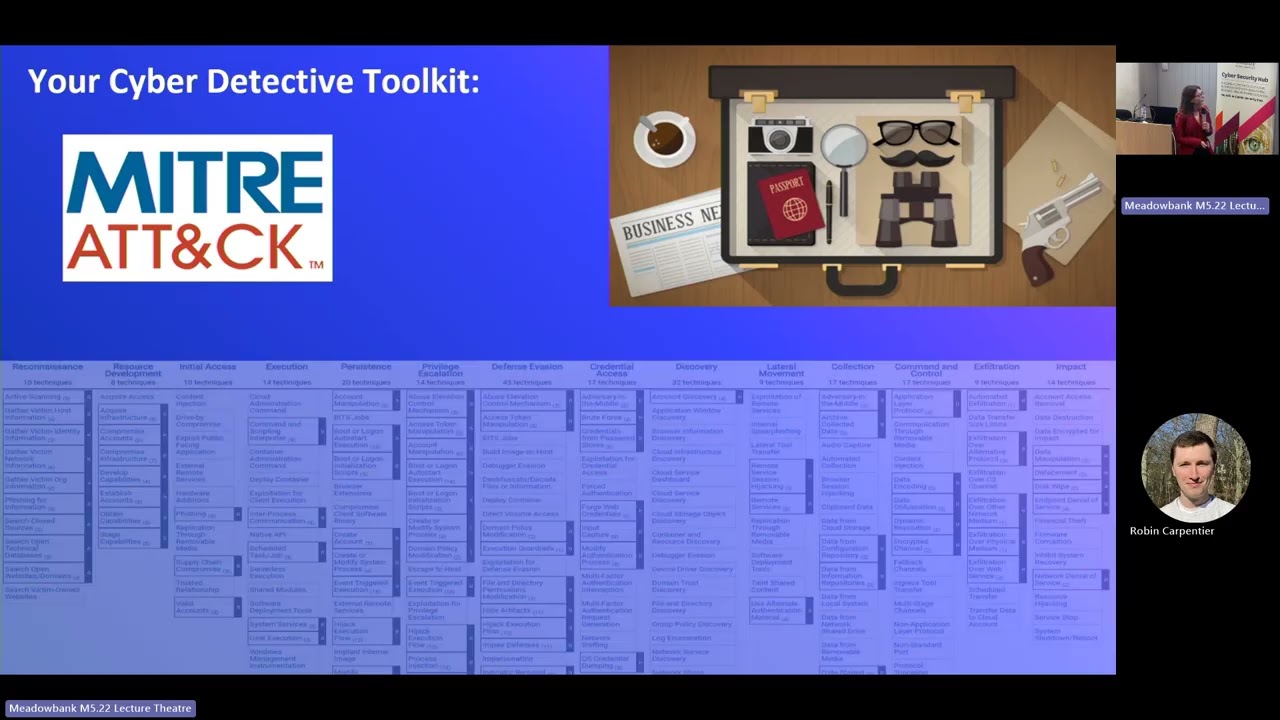 33:30
33:30 41:49
41:49