BSidesSF 2023 - FAIR STRIDE - Building Business Relevant Threat Models (Arthur Loris)
Show transcript [en]
so thank you all for coming uh I can't tell you how happy I am to be speaking here this is my favorite conference so to be able to just be standing here is awesome uh my name is Arthur I manage one of the appsec teams at Ping Identity and here I'm here today to tell you all about Fair stride which is a framework louder closer to the mic all right so I'm here today to tell you all about Fair stride which is a framework we developed uh to um to have engineering threats and the business be able to speak Apples to Apples when threat modeling
uh so just an agenda slide uh I'm going to talk a little bit about the background of uh how I got to this material and then I'll talk about the components that came into building this thing first I'll talk about stride and how we threat model with it then I'll talk about uh quantitative methods and fair and Monte Carlo simulations and uh why they matter and how they differ from how we do things typically in engineering and then I'll give a little demo so you guys have some uh some sort of tactical stuff to go home with and uh then we'll close it up
uh so back in 2019 I was at rmisc which is a conference out in Colorado which is where I live um the keynote was Miko hipponen who's the head of research for f-secure he uh he had uh during his keynote on the the state of the net uh slide that was massive that had uh tires perpetually burning and he said in security when we do our jobs right nothing happens um that was very disheartening I'd just gotten promoted to management and um you know my job is to make my team successful and to align the the success of the individuals on the team with the the interests of the business and so to hear that the best that I could do is
nothing was a problem that I couldn't ignore we tried a lot of things during that year as far as measuring our success but nothing really seemed to to hit the mark for me um until about a year later when I came to this very conference before the world shut down and uh Clint gave a uh his keynote on how to 10x your security without the series d uh the general thesis of the talk is if you're able to remove bug classes from your code base then you gain time and you move the needle measurably as far as the risk posture of your applications uh he centered this around two main use cases uh the first one was Secure by
default Frameworks and the second one was semgap rules to make sure that your code doesn't reintroduce vulnerabilities now this was really encouraging because uh for the first time I was like oh we could actually actually have a path upwards from where we are now but then I came to another realization which is I don't know what the hell risk is I don't know how to measure it I don't know how to perceive it I don't really know anything about it apart from some people talk about it and apparently bad things happen one risk is involved occasionally uh so I picked up this book called how to measure anything in cyber security risk which is absolutely phenomenal it's
very complete it has a lot of resources that have to do with quantitative methods to be able to evaluate and use risk in your Enterprise a lot of what they talk about and how they um how they position things in that book is very much from a CSO View and what we're going to do today is we're going to bring that down to the appsec level so it's really just a re-scoping of all the techniques that are that are in that book I got the audiobook it was like nine bucks so if you got nine bucks you should get that uh the last thing that I had to put up here uh is the the fair you uh risk lens
Tool uh I'm not sponsored by them or anything like that uh but it is really awesome and very easy to use uh and you can get kind of a very elegant view of how far works and how quantitative methods work uh with like a very small amount of effort relative to reading that whole book so if you want to give it a shot give it a shot it's awesome
all right so what are we doing today as far as modeling threats um there are many approaches to uh to threat modeling but today I'm going to talk about stride so stride was invented at Microsoft in the early 2000s as a part of their secure Computing initiatives uh there are as I mentioned other methods more artistic than others to be able to to model threats but stride is really good because it's a repeatable framework and if you're going to train a team of more than say two or three people it's really good to have a way to go about training them and if you have developers that are interested in uh in security and in threat modeling and you
can give them a framework again it's better for for being able to share that knowledge uh it's not rocket science but it is awesome uh what you do is uh you build a data flow diagram of your application you draw trust boundaries and processes and data stores and arrows that show how the data goes from A to B to C and then you enumerate threats that fit in the stride buckets so the stride buckets follow that acronym it's spoofing tampering repudiation information disclosure denial of service and elevation of privilege is great right we actually have a systematic way to go about seeing what might go wrong with our application even if it's not implemented yet
the output from this is a list of uh things that could go wrong or a risk registry and then we have to prioritize how we fix things do you guys hear those uh bumps in the thing uh so we have to prioritize how we fix things after we've already enumerated them and as far as I can tell in the industry we follow some some modification or some version of CVSs score calculators so you find a threat you go to the nist website you say the attack Vector is the network and the impact to confidentiality is low and then you know you click a bunch of buttons and that creates a score from 0 to 10 of uh on
the CVSs scale uh that 0 to 10 then gets mapped to a high medium or low depending on what bracket you fall into so this is pretty good right but it's not very sophisticated and I mean that from a mathematical perspective so a high medium low critical informational those are what's called ordinal scales which means that they're very good at putting things Jesus Christ what is this I put it down okay okay sounds good um so high medium low critical informational those are all um those are those are an ordinal scale which means that they're very good at putting things in order so a high is higher than a medium and a medium is higher than a low but they're not very
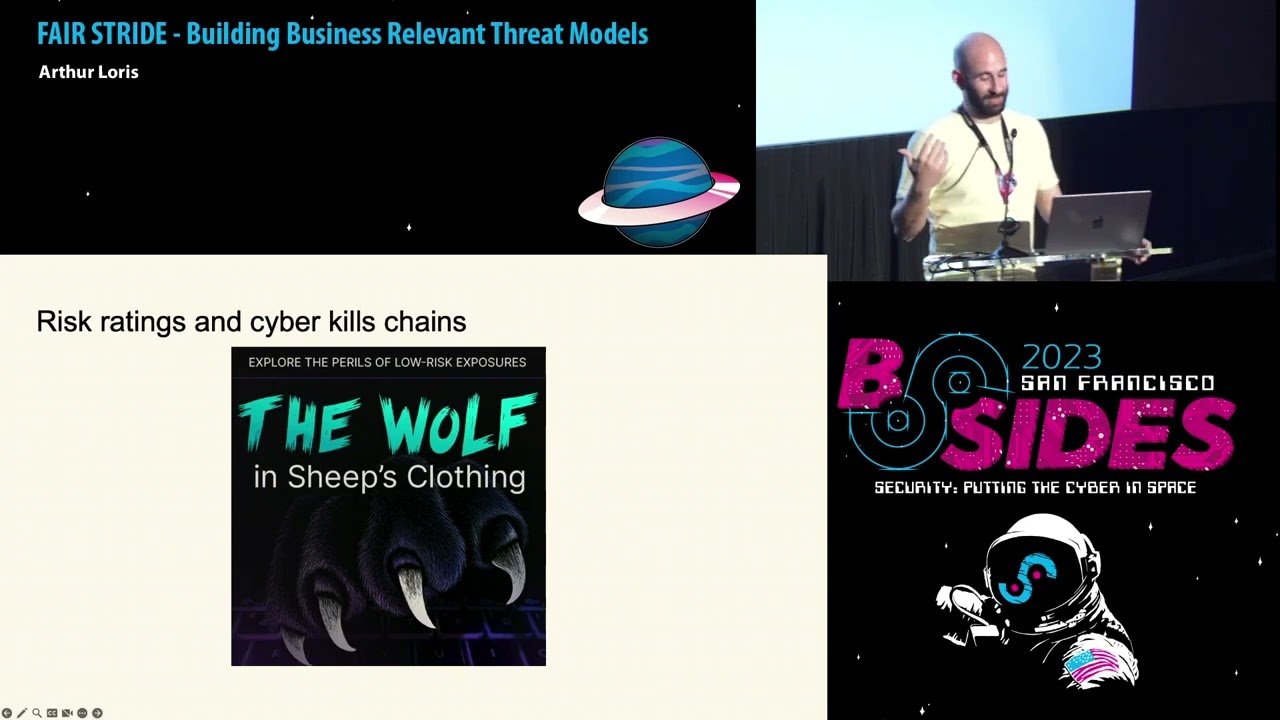
good at combining elements in each one of these buckets so you can't compare five mediums to a high and you can't compare a thousand lows to a high either neither can you compare the mediums with one another so your your security expertise might say hey this one is more important than that one but that's not a product of the scale that you're using uh to drive that point home uh Bishop Fox put out this uh this e-book called uh the wolf in sheep's clothing uh which is really fantastic um the this is basically a recollection of a whole bunch of uh nasty things that their uh Consultants did uh with a bunch of lows so from an offensive perspective
and a technical perspective uh you can combine a bunch of lows in the the kill chain but when we look at it from a risk perspective and a risk registry on the on the defensive side we don't combine them so just from that perspective we're starting already on the back foot so how can we do better um today I'm going to propose that we do things better by looking at the impact of vulnerabilities on the business rather than on the applications themselves so uh if we think about how uh you know an appsec program is built you have a whole bunch of things that generate findings you got tools you got pen testers you have bug Bounty programs you
got your internal developers that find things that are weird you got your security team that's going and trying to break stuff and all those things kind of funnel into your security team uh your appsec team can then go and say all right uh these four don't worry about them we know about a compensating control move them aside and then these two we should actually send them over to the to the remediation team and so then that gets passed over to the remediation team they go and spend some time which costs money uh to be able to uh to go fix the thing uh depending on uh you know your setup and your sdlc you might have some QA cycles that have to
uh that have to that you have to go through you might have some uh some release uh you know documentation cycles that you have to you have to go through there and all these things cost people hours which cost money um you might also have to notify your customers right if something is really bad and you have to tell them you have to set up a campaign and you have to go and uh work with people throughout your business and take their time away from their job to be able to go and fix the the thing that you found and then you also have uh people escalating up to your support team and your customer success team saying hey
this thing is broken can you please help me be reassured about my posture so all this to say we're going to look at it from a process perspective rather than a RC against uh your application perspective uh just a quick note about Fair uh fair is super elegant uh it's a way to break down risk um in in a way that's specific to infosec um I mentioned before that this is very much at the CSO View and we're going to scope this down to the uh to the application View uh if you Google for fair you're going to find this uh this tree I added a dotted line in the middle there because I just wanted to make a point that
um if you need to break things down further in the tree you can go ahead and do that but it's not necessary so you don't have to make your way all the way down to contact frequency you could just stop at loss event frequency if you if it makes sense for the way that you're estimating things and I'm going to walk through each one of these here in a sec so let's talk about lost magnitude uh loss magnitude is the amount of money that is going to cost when something goes wrong or when a loss event occurs um this is always expressed as a 90 confidence interval now what that means is that the accuracy of your estimation
is going to come from uh the the the percentage of your confidence meaning that if you create a 90 confidence interval you want to be 90 sure that there will be that the value that will occur over the next 12 months will be in that interval versus trying to be as precise as possible with your interval and making it as tight as possible so that your your um you can get the sort of the best idea of what your value is actually going to be so as an example if I'm going to estimate the price of a gallon of gas in San Francisco in 12 months I could say oh it's going to be 550. but I'm going to be wrong a lot of
the times sometimes it's going to be six bucks sometimes it's or it might be uh 450 it might be five dollars but if I say it's going to be in the neighborhood or I'm 90 sure that it's going to be anywhere from 350 to seven dollars pending any kind of geopolitical issues or pandemics or anything like that I actually have a good range where I'm confident uh that I'm 90 confident that it'll fall in that value and we allow for five percent outliers on the top and on the bottom side of that estimation foreign magnitude is broken down into primary and secondary losses primary losses are losses that happen every time that a loss event occurs and they're usually
inflicted by the business upon itself secondary losses are losses that are usually inflicted on the business by a third party and that they do not occur every time a loss event occurs a lot of what we're going to see today as far as primary losses go are going to be security engineering Cycles because all the findings will make their way into the security team to be triaged but not all of them will will have to pay a bounty for or not all of them will have to trigger engineering Cycles to go fix things
on the other side we have a loss event frequency so loss of infrequency is the probability that something bad that will cause a loss will occur within the next 12 months and we're going to use 12 months here because uh scoping the time of your probability is very very important in in the way that you get the Strategic insights out of this modeling as well as the actual probability that you're going to get so the probability that your company is going to get owned tomorrow is very very close to zero but the probability that your company is going to get owned in the next 15 years is very close to 100. so scoping this appropriately is going to give you
um is going to give you a different number as I mentioned we're going to be using 12 months here and I'll talk a little bit more about why that is as we go through loss event frequency is broken down into threat event frequency and vulnerability so threat event frequencies the frequency with which you perceive a threat from an external actor so this could be seeing a cross-site scripting payload and vulnerability is the com is the the conversion of that into a loss event vulnerability is uh broken down and actually vulnerability is defined differently in in Fair than it is inside of the usual security engineering community uh here vulnerability is not a security bug it is the relationship between the
strength of your controls and the strength of your adversaries and the strength of their attacks so vulnerability will tell us if the threat event has been converted into a loss event vulnerability is actually a quite complicated uh area of Affair that can warrant a talk and you know by itself but suffice it to say that you can think of this as uh the strength of a Dam versus a hurricane or the strength of your DDOS protection against a bunch of traffic uh threat event frequency is broken down into contact frequency and probability of action contact frequencies the frequency with which a threat actor makes contact with your asset so this can be some Recon building out a site
map etc etc and then when that cross-site scripting payload gets delivered that gets converted into a threat event and so the probability of action is the probability of that occurring so what do we do with with all this stuff we we've estimated a bunch of things uh what do we actually do with it we're going to feed all this stuff into a Monte Carlo simulation so Monte Carlo simulations were invented by John Von Neumann and stanisla ulam at the Manhattan Project they needed a way to educate their decision making so that you know based on their understanding and with a complete lack of historical data they wouldn't make any kind of egregious mistakes when you know
building the dangerous things that they built in the Manhattan Project um it's uh they called it everything had to had a had to have a code name and they called it Monte Carlo simulations after the casino Apparently one of the researchers had uh some an uncle that had some gambling problems and they said they figured they could use it afterwards to figure out how much money he might have to borrow from the family um the general idea of the Monte Carlo simulation is that we're going to take our uncertainty about our position through the the estimations that I talked about before and we're going to generate for all intents and purposes historical data so Computing has existed
for you know Linux time started in 1970 the security industry is maybe 30 years old with these methods we can generate a thousand years of data 10 000 years of data and then use that data to analyze uh or that we can then analyze that data as if it was historical and then as we make changes the data is going to change and our analysis is going to change so these simulations are always taking the form of picking points on probability distributions for today we're only going to be talking about log normal distributions to model the dollars lost for each one of the loss types that we're going to enumerate log normal distributions are suitable
for this because they have no negative values which means you're not going to lose negative dollars which is good and they also have very long tails which means that they'll pick up outlier events on the top side um and pay no attention to the numbers on the scale they mean absolutely nothing um just as an example uh these are the the black curve could be for example the the model of your um your bug Bounty payouts the blue curve might be your engineering cycles and the red curve might be for PR campaigns they all look a little bit different but they share those same uh properties and the reason they look different is because the inputs to these curves are
the estimations that we had as far as lost magnitude and also when I do the demo I'll show you uh exactly what this means
so what's the tldr uh for if you want to do Fair stride the tldr is that you're going to model threats with stride you're going to feed the output from your threat model into a Monte Carlo simulation rather than a set of CVSs score calculators and then you're going to use los exceedance curves which are the output from the model to define a baseline a goal post and to measure your progress from where you're at to where you want to be and you'll I'll show you what exactly what Allah succeedings curve is in the demo foreign so we're going to do a quick demo here I'm going to show you a big spreadsheet it's going to look really gross but I'll
walk you through it um it's not again it's not rocket science none of the data that I'm going to show you or the threats or anything like that are pertinent to uh to Ping Identity everything is completely uh completely fake um just to prove a point here and this is you know credit where credit is due this is um basically the one for one substitution model that Hubbard and searson make available for free on how to measureanything.com cyber security so if you want to use the actual simulation here you can go and download it there for free or you can hit me up after this talk and I can give you this version of it
all right bear with me here when I do the display thing
that's not right
it's gross isn't it um can you all read this or do you need me to zoom in more it's good all right um so you'll see here on the left uh these merge cells these are the different threats that we've enumerated during uh during threat modeling so you'll see here we have S1 for spoofing one uh we got some tampering down here we got some repudiation some information disclosure we got some denial of service and we got some elevation of privilege now instead of having the output of this be a high medium or a low we actually have a list of things that can go wrong also known as loss types so these are all things that can cost
money and that don't always cost money I mentioned earlier primary and secondary losses they have um you know secondary losses have a probability of occurring that is not a hundred percent primary losses will occur every time so you'll see here the the primary losses that we have are essentially just security engineering Cycles now you'll note here that uh that it doesn't say a hundred percent that says twenty percent um that is the probability of the event occurring over the next 12 months now the 20 here is just making a point so if for example you're implementing best practices and you have um let's say you you have TLS uh implemented everywhere which is pretty standard these days and somebody uh is
starting to to move data uh confidential data in transit through that um you know if you were to go to your engineering team and say what are we going to do to make that better they're going to say we're already doing the best thing you know please go away and do something else but that doesn't mean that best practice today won't be best practice tomorrow so you know pre-log for J things threat models would have looked very different as post log4j and so what you can do is you can go look at historical data and cve databases are quite robust and have have a lot of information in them you can go back into your historical data of
cves and say all right in the last say 10 years how many years have there been one or more cves that have broken the confidentiality of TLS in one way or another and you can count them you can say all right well there were two years out of the last ten where confidentiality was broken in TLS therefore it's reasonable that we would have a 20 chance of this best practice being broken over the next 12 months obviously that's not a spoofing issue but I'm just making a point uh you'll see below here for example that we have uh the probability that we're going to have to pay out a bounty is going to be the probability that the event actually
occurs times the probability that uh it came from the bug Bounty program so you can go through all the vulnerabilities that you've uh that you've had over the last uh say a year or two and count the ones that came from the bug Bounty program and say all right it's reasonable that you know a subset of those are going to be you know maybe x amount of percent are going to be um coming from the bug Bounty program and you just multiply one by the other and that gives you a smaller percentage of having to actually pay out the bounty uh here are the 90 confidence intervals for each one of these loss types you can
measure these differently so if you're going to measure uh say support Cycles you might those might be measured by that business unit by the number of or the the average cost of a of a support case and Counting the support cases that are pertinent to uh to security you might also go look at your your engineering cycles and say how much is it going to cost me to actually fix a bug like how can I come up with an estimate for that so you can go and look at you know how the the quickest and the longest uh time it's taken to fix a security bug inside your organization multiply that by the average hourly rate
of your um of your engineers if you have access to that information if not you can just go to Glassdoor and that'll give you an estimate for a lower bound and an upper bound and you'll note that all the ways that you measure these things are different for every loss type but they boil down to Dollars ultimately which means that you can normalize them to dollars all right so now for the meat and potatoes so uh these three columns here so simulated inherent loss impact Rand and probability Rand are essentially the simulation um in action probability Rand is the probability that the event actually occurred uh you'll note that probability Rand is the same for each one of each one of these loss
types that's because we don't want uh you know I talked about how you have security having the uh being being engaged every time and then the other loss types not being engaged every time we don't want a higher probability for some of the loss types that shouldn't be happening if security was not engaged so since this is for one specific threat we actually have the same random number selected for all of them impact Rand is going to be picking the random point on the probability distribution of the simulation and this really weird looking formula is the actual simulation so you'll see here that if the probability Rand is smaller than the probability of the event occurring
then you you get a loss event if not nothing happens and you'll see here nothing happens for this specific type um if you do end up uh having this probability ran being smaller than your than your estimation you're going to go into this lognormal.m function and if not you're going to go to zero the lognormal.inv is the actual function that's going to pick the point on the on the distribution you'll note that it takes in the uh the random number right here and it takes in the mean as uh it takes in the um your balance for your confidence interval as the mean and then it takes in your bounds from your confidence interval as the standard
deviation you'll note that 3.29 figure there that's based on the 90 of the confidence interval that fig that number will be different if you're 80 or 95 but I'm not going to get into that but essentially what you end up with is sometimes nothing happens for a particular threat or for certain losses and sometimes things do happen so you'll see that in this case we lost twenty two thousand dollars due to security engineering Cycles because of this spoofing threat I mentioned earlier that we're going to be simulating a thousand years of data so right now what we're looking at is year number 62. so on year 62 if we add all the values together of the simulated inherent loss
we end up with 225 807 so that's how much we lost because of security issues based on our understanding against this specific application on year 62 of the simulation
and if we go down here at the table that shows you all the years of the simulation you'll see that year 62 we lost 225 807 dollars you'll note that on year 63 we lost almost 800 Grand on year one we lost over a million bucks but on year seven we only lost 167 000. so our uncertainty has now been extrapolated into these these uh these outputs in dollars and now we can ask some really interesting questions and the most important one is what is the probability that we're going to lose X dollars or more over the next 12 months due to security issues and we can just count right we can go to 280 000 and say all right I'm going to
count how many of these values are greater than 280 000 and 47 40.7 percent of them will be uh you'll note that we've had no losses less than 140 Grand for this application and the most that we've lost is a little bit over 2.1 million okay so we're going to plot those against each other and we're going to end up with with what's called a lost exceedance curve the law succeedance curve is a more mathematically sophisticated way to um to to um to express the risk of our application versus a registry of a whole bunch of items that are high medium or low you'll note here that inherent risk is red and residual risk is green
residual risk is the measure of our progress inherent risk is our Baseline for some reason Excel put the green curve on top of the red curve but they're they're the same at this point now the interesting thing is we can go to an executive and we can say hey executive what probability are you willing to accept that you will lose 500 Grand or more against this application over the next 12 months and they might say well I don't want to lose any money against this application um and we could say okay that's good but based on our simulation we found that right now we're accepting a 7. 7.7 chance that that's going to occur so
what's something reasonable that makes sense for you and you can negotiate that and in this case we negotiated two percent you'll note that the values here are always going to be 100 for 100k and uh 20 for 200k and much much smaller for a million so now we have a Baseline and we have a goal post and now we can measure our progress from one to the other so if for example I want to say Implement a sem grep rule to remove a particular bug class from my uh from my code base I can do that and I can measure it against a process Improvement so I'm going to be measuring a technical control against uh against the process
which is not something you can do with cbss scores so for example this elevation of privilege has two attack factors it's either through Json so remote code execution through Json processing or through XML let's say you write a semgrap rule to make dtds disabled by default and you therefore reduce the likelihood of this specific threat Happening by 50 because you remove 50 of the attack vectors and so you can add that value into this into this sheet
and then I can rerun my simulation and lo and behold the the green curve has moved away from the red curve so the the needle that we've moved is the area under each one of these curves so some uh some businesses might only care about losses greater than a million some business some businesses will will look at this more holistically but what we've done here is we've seen okay well we started at area equals X and now we're at area equals x minus k so we've moved that needle now the interesting part is how does this compare to a process Improvement so let's say we notice that we spend a lot of time responding to customer
escalations and maybe we have good relationships with our support org and we're able to build an FAQ that says uh hey this is how you're going to respond to these things and we might reduce the impact of that or the likelihood of that occurring by say 10 and maybe we we hope to be able to do that so I'll go to my customer success Cycles here and my support loss type and let's say I can reduce those by 10 percent
and now I can apply this to all possible threat types because the the support Cycles are going to apply across the board it doesn't matter if support's responding to uh you know elevation of privilege or denial of service whoops just bear with me for a second cool and now I can rerun my simulation and lo and behold the residual risk curve has moved differently away from the inherent risk curve so I've now if I'm if I compare the area under the curve of this versus a sem grub rule I can actually compare their impact Apples to Apples now it might be very cheap to implement a sem grep rule you just go write some yaml and you're done but
maybe you work at a really Legacy organization that doesn't have a CI CD pipeline or doesn't have all the infrastructure needed to have sem grep in place maybe you work at a modern organization that doesn't yet have some grep implemented and that might cost some money and some time to set up so you can you can do a cost benefit analysis for that versus setting up an FAQ or building a self-serve tool for for support and from a leadership perspective this is really exciting because I can build initiatives for my team that are meaningful to the business and that so they can understand the impact that they have and I can actually go report that
back to somebody that cares about dollars and that's super exciting to me
that's not right
there we go
cool so again what's the tldr for fair stride you model threats with stride you feed the output of your threat model into a Monte Carlo simulation rather than a bunch of CBS escort calculators and then you use los exceedance curves to define a baseline a goal post and your progress from point A to point B so how can this uh improve your program well um as I mentioned you can meaningfully prioritize your efforts Beyond compliance compliance is super important because it you know even though it's check boxy and it's not like the coolest thing in the in the security World it actually brings dollars in because it enables your business to sell the thing that you're doing compliance
for so that's great on the one side but then on the other side once you're done with that and you've automated your way through it what your purpose is is to reduce the at least as an appsec team is to reduce the losses associated with uh with security issues and so we're actually able to do that here which means that we can have Insight that is strategically significant and actually be able to build something that our Engineers care to contribute to this is heavily related to that third point about reducing burnout um I think this year there's a few talks about burnout and last year there were also like two or three talks about burnout at this at this conference uh we
have a pretty rough job in security everything's broken all the time sometimes people get cynical and a lot of the times that happens because what we're doing isn't necessarily perceived as meaningful by the business but if the business stakeholders understand what we do in the same way that what the product teams do as far as dollars then we we can put ourselves in a position that's at least setting us up in the language of success maybe your insights won't be as successful as others but at least you're on this on this trail that everybody understands and from a leadership perspective again that's super super uh exciting my job is to make other people successful and this
is a way to do that um that point in the middle about justifying investment or why not to pay for things if you can use these methods to understand what the value of a particular problem is to you or at least get a sense of it so if a vendor comes to you and says hey I'm solving this new and interesting problem give me a bunch of money you can actually have some leverage on how much money that thing might cost and why that's important uh this will also avoid you hiring too many people or Justify whether or not you need to hire more people if you have too many people on your team uh you're
lucky but at some point uh the business is going to realize and they're going to say no you gotta you got to get rid of some people and that's not fun for anybody
cool so uh if you want to use Fair stride this is a way that you might be able to do that you can do an assessment now which means that you're going to have to go talk to a bunch of people about money and then you're going to have to go talk to your engineers about the probability of bad things happening and what bad things might exist against your applications um you're going to get some strategic insights from that and be able to build some initiatives around them you're going to execute on those initiatives and measure them independently but then ultimately boil the progress that you have on all of them back to dollars or
likelihood of occurrence so you would measure the adoption of a semrep rule differently than you would measure how long it takes to fix a bug but ultimately all those things will boil down to either one or the other uh and then you're going to repeat the assessment uh 12 months from now um your application will have changed uh 12 months from now your controls will have changed the threat landscape will have changed substantially a lot of things will be different so being able to repeat this process and create the next year's initiatives and goals and so forth is going to be a good way forward and that's pretty much it um that's my LinkedIn I know it's like
weird to show QR codes at security conferences but you know you don't have to you don't have to you don't have to look at it if you have any questions or if you want to have if you want to have any of the the materials that I shared today please hit me up I'm happy to share everything none of this is my intellectual property I just smooshed a bunch of things together in a way that makes sense to me so thank you
just give me a sec he was first uh thank you so much for the presentation it's a topic that's close to my heart also know ping very well friends work there I was in this space for about 10 years I worked at HSBC so when I joined I my job was to work with the developers and help figure out how to prioritize all the issues right and as you pointed out models like CVSs or severity doesn't really have the business context so you can't really calculate risk based on just severity you need impact or as you call it loss and likelihood to be able to calculate risk the challenge that we encounter when I saw when I first went down that
path okay the swap model this come up with a risk so that we can prioritize based on risk and they can focus the development effort where it matters most so you can avoid burnout and you know spitting your your Cycles where it doesn't matter we started just eyeballing it right as you said that doesn't really work I mean it's one's opinion is different than someone else's opinion so we started looking at models like this where you provide specific percentages and numbers and all that and it became complicated like no one wants to go through all those and not only is it complicated but also the problem is that you may not have data right like
you're saying well look at the previous loss so some teams are like I never measured it a team is brand new so you may not always have the metrics so it was like on the one side as you eyeball it on the other side you go through a really scientific model like this and neither works very well at scale so what we came up with something is in the Middle where you're not eyeballing it and you're not providing all the specific data so we looked at dread right so dread has been deprecated because there's some problems with it but we like the Simplicity because it was like you know what let's take your impact and break it into reputational
impact you know how many users were impacted and the financial damage was direct or indirect but instead of putting numbers just say hey a three means you'll go out of business everyone can tell like that's that's easy a one is like no one hears about it and two's in the middle you lose some customers you feel the pain right that's easy for everyone to think about you don't need to do all the scientific analysis and that model seem to work really well so and I run a consulting company now we use that model not continually monitoring how others do it and I wanted to get your feedback like how easy is it to calculate all these numbers how do
you address it when you don't have historic data it seems like a lot of work and a lot of complexity whereas why haven't you gone for a simpler model like where it's just that you know three two one and you assess that and you calculate the risk that way definitely agree that risk is important severity is definitely it's my pet peeve I hated when people just slap a severity and say here you go here's 100 issues and you know there's no risk and of course I came from a banking so everything runs based on a risk model yeah I would love to hear your opinion on that yeah definitely um and we should get a beer
after it because I want to I want to talk a bit more about that with you um this was this took this took some time um I think it took about like Ping has um I think 1300 employees nowadays it took me about three months to build the model um once you have the base you can iterate on it pretty quickly but if you if you have really big companies there I know that there are ways to to go about doing it that makes sense that that are um based on inference and and running certain um sort of Bayesian inference things that I don't know much about but I know that there are ways to go about doing
that um the I think the the thing what's important to understand is that this is a tool that needs to be useful and if it's not useful and you have to adjust you should absolutely adjust um if this model takes you six months to build and you're trying to build for 12 months in the future it's kind of ridiculous so you know that's got that's kind of my my high level take on it but we should talk about that a lot more sounds great thank you absolutely uh yeah what's going on
thank you I also use the fair model um in my job I also studied the um as a risk officer so it's uh it's very interesting for me and my question is my big challenge was to build the threat list so the one that you have shown in the Excel and my question was uh very let's say very basic where did you get that and does it come from the Hubbard XL which I don't remember to be honest or did you build it yourself is that where you used your three months no so actually getting the threats out were um pretty easy relative to getting all the business unit owners to give me numbers uh and to explain to them what
confidence intervals are the threats themselves I mentioned I run an app sack team so I have a team dedicated to doing this so we're pretty we're pretty on top of it when it comes to to building out those threats but it's an engineering exercise so uh I noticed in your model you had a phrase here called a revenue risk due to churn which is a security architect I can tell you is very near and dear to my heart okay um which I am interpreting as uh this is such a problem that the entire team leaves and that is something I've observed um I'm wondering how did you evaluate that or how did you actually try and build that into your model so
actually the definition that we had or that that I have here for it is churn of customers so customers leaving you because they don't trust your product anymore um I mentioned you know when we do compliance and stuff it's really to you know enable a language of trust with customers and if that trust is broken they're going to get out of there you know so that that's the type of churn that we talk about um and you can measure that one based on you know product X makes this many dollars per year this is what the impact of it will be um uh before people leaving and uh for people like people leaving your team
um I had a I had a line item in there about people getting fired actually rather than people leaving um I think that if you if you you know I take pride in the fact that I'm able to to hold on to people for a long time because I try to build a a program that's comprehensive and that's uh that's fun for everybody including the business um but yeah sometimes people get fired and you can you know you take salary data and you're like oh it's going to be about that much
oh yeah hi um so great presentation I I um I work in the secure GRC where I'm so fair I understand fair and I never had a chance to implement at my workplace is is um is a little bit tough to implement my work because it can go really deep right and I see expression right I see that you have a column called loss type right do you have a process or do you have a source to define the list of loss types absolutely um so I look internally at my program and I look at all the things that's that we spend time on as a team and as a company so I start with my team and I as
the sort of intake point for all the security things uh for applications and then I look at all the teams that we impact Downstream and that's pretty easy on my end because I talk to these people regularly they're people that I have one-on-ones with when uh when you when things go wrong they're the people that I work with so I kind of know who's impacted by security issues at my company um and so that's how I build those lost types they're Cycles if we think about assets and the most expensive things that companies have it's the rent that you pay for your offices and how much you pay your people and so everything that's here is the the dollars are all
people's time really
you know I might have missed it but where's the intersection with corporate security and the risk and are they using the similar model and is there does that get up leveled when you're talking about resources for for team members or whatnot across the court the whole organization when you say corporate security do you mean non-app site non-product side so you have risks in the organization that are not application being customer facing do they do a similar Fair model are you doing that for them I'm just doing this in a box to help my team I'm not I don't like um I know what you mean like the scope expands and the way that you know you might lose money
diversifies quite a bit um the book is actually scoped to that uh to that level um but we don't do that I'm just doing it myself and it's uh it's been helpful for me yeah and I was just more wondering if your peer on the corporate security side if they're if you're they're doing the same thing right and up leveling the risks to the like a cheap risk officer or anything like that that they have not done that yet all right awesome thank you I wish they did but they haven't uh yeah for sure
I'm really curious how you sanity check your model one thing we know about uh complex models is that they errors are really easy to hide in the data and um having tried to build these models myself I've seen those errors uh in my own models and now that I'm managing some other people trying to do this it's even harder to to check their work so um sanded checking yeah uh you need to teach me about that because I know there are ways to do it and I know there are ways to evaluate and to to go about that but I I don't I'm not an expert in that by any stretch of the term my my rough
idea that I have not tried yet is to implement layers of models with increasing levels of complexity and to make sure that the more complex models are kind of roughly similar to the simpler models we should talk about that more um I know that I know for sure that there are well-defined ways to do it I know that they're covered in the book and I can't I can't recall them off the top of my head but there's definitely like well-defined ways to go about it there's one down here
again this steps in as you're as your team grows and expands and other teams want to continue using a model like this how do you support other people onboarding into what is a kind of a potentially kind of very internalized model that you've created how do you train others to be able to pick it up even if you were to switch roles or switch teams um so the question is like how I would evangelize this across my organization or how I would pass the torch down if I were to do something different yeah yeah how do you while I've like thought to build models like this and then worry that if I reprioritize my own work and I
step off the team or if I change companies you know what will happen to that model after I leave or after you know someone else is picking it up as their area of responsibility is that something that you have recommendations for or um I can't say that I've done this myself but uh because I've used this again for my team personally as as um in a bubble almost but what I would recommend would be to educate people above you in the chain of command as to how um the value of this and then educate the people that are implementing the the initiatives that come from the insights you get from this as to how they relate
back to the model so hopefully whenever somebody new comes in the top and the bottom will be able to sort of create pressure on that person to be to continue using those models but I haven't done this myself thank you okay if you have any more questions you can ask them outside let's give Arthur a round of applause thank you [Applause]
Related talks
 28:29
28:29 29:24
29:24 32:13
32:13 30:17
30:17 38:53
38:53 32:39
32:39